SlideShare una empresa de Scribd logo
1 de 408
Descargar para leer sin conexión
Welcome to Instrumentation, Process Control
and Process Instrumentation & Diagram
By: Dr. Zin Eddine Dadach
Chemical Engineering department
ADMC
1
 The first part of this course introduces the students
to the basics of electrical circuit theory followed by
the latest process instrumentation technology and
selection criteria.
 This section explains the measurement of common
process variables such as temperature, pressure,
level and flow and describe their corresponding
sensors.
 A lab experiment on calibrating a manometer.
PART I: Instrumentation
2
Define and explain the
various circuit
components and describe
the basic of electronic
theory.
L.O. #1
3
 SENSORS, TRANSMITTERS AND CONVERTERS ARE
ELECTRICAL AND ELECTRONIC DEVICES THAT
TRANSFORM PHYSICAL PROPERTIES (PRESSURE,
PRESSURE DROP, DISPLACEMENT, HEAT..) INTO
ELECTRICAL CURRENT
 IT IS THEREFORE NECESSARY TO STUDY SOME
BASIC THEORIES OF ELECTRICITY
4
THE NEED OF ELECTRONIC IN
INSTRUMENTATION
CURRENT
AMPERE
5
WHAT IS CURRENT?
 Electrical current is the movement of charged particles in a specific
direction
 The charged particle could be an electron ,a positive ion or a negative
ion
 The charged particle is often referred to as a current carrier
 In a solid, the current carrier is the electron
 The symbol for current is I
6
 An ammeter is a measuring instrument used
to measure the flow of electric current in a
circuit.
 Electric currents are measured in amperes,
hence the name.
 The word "ammeter" is commonly misspelled
or mispronounced as "ampmeter" by some.
7
AMMETER?
 More modern ammeters are digital, and use
an analog to digital converter to measure the
voltage across the shunt resistor.
 The current is read by a microcomputer that
performs the calculations to display the
current through the resistor.
8
MODERN AMMETERS
Direct current (DC) is the unidirectional
flow of electric charge. Direct current is
produced by sources such as batteries,
thermocouples, solar cells, and electric
machines of the dynamo type.
DC: Direct Current
9
 In alternating current (AC), the movement of
electric charge periodically reverses direction.
While in direct current (DC), the flow of electric
charge is only in one direction.
Alternating Current
10
11
WHAT IS A VOLTAGE?
VOLT
12
Voltage is the electric pressure OR
POTENTIAL that causes current to flow.
Voltage is also known as electromotive
force or emf or potential difference.
If there is no potential difference (V=0),
there will be no current (I=0)
13
VOLTAGE =POTENTIAL
 We need a unit to indicate the potential energy
between two points such as terminals of a battery.
 This unit must specify the energy available ( JOULE is
unit for energy) when a charge ( COULOMB is unit for
charge) is transported.
 The unit of voltage is : Volt= joule/coulomb
14
UNIT OF VOLTAGE?
 The moving coil galvanometer is one example of this
type of voltmeter. It employs a small coil of fine wire
suspended in a strong magnetic field.
 When an electrical current is applied, the
galvanometer's indicator rotates and compresses a
small spring.
 The angular rotation is proportional to the current
that is flowing through the coil
15
OHMMETER OR GALVANOMETER
16
OHMETER
 The opposition a material offers to electrical current
is called resistance
 All materials offer some resistance to current
 Resistance converts electric energy into heat
 The symbol for resistance is R
 The unit of resistance is the Ohm (Ω)
17
WHAT IS ELECTRICAL RESISTANCE?
 Conductance refers to the ability to conduct current.

 It is symbolized by letter G
 The base unit for conductance is the siemens or S
 CONDUCTANCE IS THE EXACT OPPOSITE OF
RESISTANCE
 R=1/G or G=1/R
18
WHAT IS CONDUCTANCE?
 Materials with a big resistance are : INSULATORS
or RESISTORS
 Examples of insulators : paper, wood, plastics,
rubber, glass and mica
 Materials with a small resistance are :
CONDUCTORS
 Examples of conductors : Copper, aluminum,
silver
19
CLASSIFICATION OF MATERIALS
 OHM’LAW: The relationship between current (I),
voltage ( V) and resistance (R) was discovered by the
german Georg OHM
 I= V/R
20
OHM‘S LAW?
 How much current ( I) flows in a circuit where the
voltage is 2.8 V and there is a resistance of 1.4 Ω in the
circuit?
21
CLASS WORK #1:
 How much voltage is required to cause 1.6 amperes in a device that
has 30 ohms of resistance?
 The current flowing through a 10 kΩ resistor is 35mA. What is the
potential energy difference ( voltage) across the resistor?
 A lamp has a resistance of 96 ohms . How much current flows
through the lamp when it is connected to 120 volts?
 A manufacturer specifies that a certain lamp will allow 0.8 ampere of
current when 120 volts is applied to it. What is the resistance of the
lamp?
22
Home work #1
Multi-loads
23
 A great majority of electrical circuits operate
more than one load. Circuits which contain
two or more loads are called multiple-load
circuits.
 A multiple-load circuit can be a series circuit, a
parallel circuit or a series-parallel circuit
24
INTRODUCTION
 A series circuit is the simplest circuit.
 The conductors, control and protection devices,
loads, and power source are connected with only one
path to ground for current flow.
 The resistance of each device can be different.
 The same amount of current will flow through each.
 The voltage across each will be different.
 If the path is broken, no current flows and no part of
the circuit works
25
A SERIES CIRCUIT
26
SERIES CIRCUIT
VT= V1 +V2+V3+….
IT=I1=I2=I3+……
RT= R1 +R2+R3+….
Calculations
27
LISTEN..LEARN..THINK..ENJOY YOURSELF 28
EXAMPLE OF CALCULATION
LISTEN..LEARN..THINK..ENJOY YOURSELF 29
EXAMPLE OF CALCULATION
 A parallel circuit has more than one path for current
flow.
 The same voltage is applied across each branch.
 If the load resistance in each branch is the same, the
current in each branch will be the same.
 If the load resistance in each branch is different, the
current in each branch will be different.
 If one branch is broken, current will continue flowing
to the other branches
30
PARALLEL CIRCUIT
31
PARALLEL CIRCUIT COMBINATION
 VT=V1=V2=V3=…
 IT=I1+I2+I3+…
 (1/RT)= (1/R1) +(1/R2)+ (1/R3)+…
Calculations
32
LISTEN..LEARN..THINK..ENJOY YOURSELF 33
EXAMPLE OF CALCULATION
1) THREE RESISTANCES ( 35, 70 AND 45 OHMS) IN
SERIES WITH A VOLTAGE SOURCE OF 90V,
 CALCULATE : IT,RT,VR1,VR2,VR3
2) WHAT IS THE TOTAL RESISTANCE OF A SERIE OF TWO
RESISTORS 20, 30 OHMS IN PARALLEL WITH A SECOND
SERIE OF RESISTORS 70, 80 OHMS?
LISTEN..LEARN..THINK..ENJOY YOURSELF 34
HOME WORK
 Electrical energy is undoubtedly the primary source of energy
consumption in any modern household.
 Most electrical energy is supplied by commercial power
generation plants like Tawillah
 The most common power generation plants are fueled by : Fuel
gas or fuel oil
35
WHAT IS ELECTRICAL ENERGY?
 When a current flows in a circuit with resistance, it does work.
 Devices can be made that convert this work into heat (electric
heaters), light (light bulbs and neon lamps), or motion (electric
motors)
 P=W/t
 P is the power and the unit is watt,
 W is energy in joules and t time in seconds
 1 Watt = 1Joule/second.
36
GENERAL DEFINITION OF POWER (P)
 Electric power, like mechanical power, is represented
by the letter P in electrical equations, and is measured
in units called watts (symbol W).
 P = I .V
 where
 P = power in watts
 I = current in amperes
 V = potential difference in volts37
ELECTRICAL POWER
 Joule's law can be combined with Ohm's law to produce
two more equations:
 P= I2.R
 and
 P=V2/R
 where
 R = resistance in ohms.
 For example:
 (2 amperes)2 × 6 ohms = 24 watts
 and
 (12 volts)2 / 6 ohms = 24 watts
38
ELECTRICAL POWER: OTHER FORMULAS
 What is the power input to an electrical heater
that draws 3 amperes from 120 volt outlet?
 Find the power used by a resistor of 10 ohms
when a voltage of 1.5 v is applied
39
CLASS WORK #2:
 How much power is dissipated when 0.2 ampere of
current flows through a 100 ohms resistor?
 How much energy is taken from the battery by the
resistor ( 10 ohms) if the voltage is 1.5 V and the
switch is closed for 30 min?
 What is the cost of operating a 100 watt lamp for 3
hours if the rate is 6 cents per kWh?
 An electrical iron operates from 120 volts outlet and
draws 8 amperes of current. At 9 cents per kWh , how
much does it cost to operate the iron for 2 hours
40
HOMEWORK #2:
Measuring resistances,
currents and voltages
using multi-meters.
LAB #1: Basic electricity
41
INSTRUMENTATION
FIRST AND THE MOST IMPORTANT STEP
OF PROCESS CONTROL
42
INSTRUMENTATION USE SENSORS LIKE
THERMOCOUPLES, PRESSURE AND
FLOW SENSORS TO MEASURE THE
DIFFERENT PARAMETERS IN THE PLANT.
 INFORMATION IS SENT TO THE
CONTROLLER ( IN THE CONTROL ROOM)
TO TAKE APPROPRIATE ACTIONS.
.
43
DEFINITION OF INSTRUMENTATION
 Measurements have got to be one of the most
important equipment in any processing plant.
 Since successful process control requires
appropriate instrumentation, engineers
should understand the principles of common
instruments.
44
GOOD INFORMATION=GOOD CONTROL
 Like human body uses nerves, Sensors are used for
process monitoring and for process control.
 Sensors are essential elements of safe and profitable
plant operation.
 This can be achieved only if the proper sensors are
selected and installed in the correct locations.
 While sensors differ greatly in their physical
principles, their selection can be guided by the
analysis of a small set of issues .
45
INSTRUMENTATION USE SENSORS
 TEMPERATURE
 PRESSURE
 LEVEL
 FLOW
46
THE FOUR MOST IMPORTANT VARIABLES IN
ANY INDUSTRIAL PLANT
Explain theory and apply the principles of
temperature measurement and select the
appropriate sensor for the application and
discuss their common operating and
troubleshooting problems.
L.O #2
47
TEMPERATURE
48
 The temperature is the most important variable in a chemical
process. Very often, the temperature should be controlled very
precisely like:
 In a reactor where the reaction outcome depends on the
temperature’
 For safety reasons where explosions can occur
 Therefore, temperature need to be measured precisely with a
very accurate sensor.
49
INTRODUCTION
 ITS-90 (International Temperature
Scale of 1990- used as a worldwide
practical temperature scale in
national metrology labs like NIST,
NPL et al).
50
INTERNATIONAL STANDARDS FOR
TEMPERATURE MEASUREMENTS
Fluids and solids are composed of atoms or molecules
These atoms or molecules vibrate, rotate and move in
general, the atoms have an average energy
When is cold, they move slowly and the energy is low
when it is hot, they move fast and the energy is high
51
WHAT IS TEMPERATURE?
 SCALES ARE INTERNATIONAL STANDARDS USED
IN ALMOST ALL THE COUNTRIES
 CELSIUS SCALE OR CENTIGRADE SCALE:
 FROM 00C ( melting ice) TO 1000C ( boiling
water) at 1 atm.
 KELVIN SCALE :
0 K = -2730C
T (K)= T(0C) + 273
52
SCALES FOR TEMPERATURE
 AMERICAN SCALE:
 RELATIONSHIP BETWEEN FAHRENHEIT AND CELSIUS
SCALES :
320F = 00C
2120F= 1000C
 T(0F)= 1.8xT(0C) +32
53
FAHRENHEIT SCALE
 RANKINE SCALE :
T(0R) = T(0F) + 460
T(0R) = 1.8 x T(K)
54
RANKINE SCALE
 Convert 1000C into :
 K, 0F,0R
 Convert 50 K into:
 0C, 0F,0R
 Convert -750F into:
 0C, K, 0R
 Convert 0 0R into:
 0C,0F, K
55
HOME WORK
 T = temperature
 TI = Temperature Indicator ( in plant)
 TT= Temperature Transmitter
 TC= Temperature Controller
 TRC= Temperature Recorder & Controller
 TCV= Temperature Control Valve
TAG DESCRIPTORS FOR
TEMPERATURE
56
RTD= RESISTANCE TEMPERATURE
DETECTOR
THERMISTOR= THERMAL RESISTORS
THERMOCOUPLES
Radiation pyrometers
57
TEMPERATURE SENSORS USED FOR PROCESS
CONTROL SYSTEMS
RESISTANCE TEMPERATURE DETECTORS
RTD
58
 A Resistance Temperature Detector (RTD) is a device
with a significant temperature coefficient (that is, its
resistance varies with temperature).
 It is used as a temperature measurement device,
usually by passing a low-level current through it and
measuring the voltage drop.
59
DEFINITION OF A RESISTANCE TEMPERATURE
DETECTOR
 The relationship between the
resistance of a RTD and the
temperature of the medium is the
temperature coefficient α of the RTD .
 coefficient α is also the sensitivity of
the RTD
60
TEMPERATURE COEFFICIENT α OF A RTD
 α IS A LINEAR APPROXIMATION BETWEEN RTD RESISTANCE
AND THE TEMPERATURE :
R(T)= R(TO) { 1+ α.ΔT}
 R(T)= approximation resistance at Temperature T
 R(T0)= resistance of RTD at T0
 ΔT = T-T0
α depends on R(T0) and α> 0 because
Metal resistance increases with temperature61
TEMPERATURE COEFFICIENT α OF A RTD
Platinum is very repeatable, quite sensitive and
very expensive
 For Platinum, coefficient α is around 0.004/0C
 Example: for PRTD of 100 Ω, if the temperature increases by 10C, R(T)
changes by 0.4 Ω
Nickel is not quite as repeatable, more sensitive and
less expensive
 For Nickel, coefficient α is around 0.005/0C
 Example: For RTD of 100 Ω, if the temperature increases by 10C, R(T)
changes by 0.5 Ω
62
SENSITIVITY α OF DIFFERENT METALS
RTD's are the best choice for
repeatability, and are the most stable
and accurate. However they have a slow
response time and because they require
a current source they do have a low
amount of self heating.
63
ADVANTAGES & DISATVANTAGES OF RTDs
 RTDs work in a relatively small temperature domain,
compared to thermocouples, typically from about
 -200 °C to a practical maximum of about 650 to 700 °C.
 Some makers claim wider ranges and some construction
designs are limited to only a small portion of the usual range.
64
RANGE OF TEMPERATURES FOR RTD
 A special set of RTD’s are called PRT’s because they
use platinum are a material
 A special set of PRTs, called SPRTs, are used to
perform the interpolation in such labs over the ranges
13.8033 K (Triple point of Equilibrium Hydrogen) to the
Freezing point of Silver, 971.78 °C.
65
RANGE OF TEMPERATURE FOR PRT (
PLATINUM RESISTANCE TEMPERATURE)
THERMal resisISTORS
THERMISTORS
66
 Thermistors are temperature sensors that use semiconductor
materials not metals like RTD’s
 R(T) = R(T0) {1+ α (T-T0)}
Semiconductors for temperature sensing have Negative
Temperature Coefficient (NTC) OR α< 0
 Semiconductor becomes a better conductor of current.
Resistance decreases when the temperature increases.
67
DEFINITION OF THERMAL RESISTORS
 The characteristics of these devices are very
different from those of RTD’s
 Thermistors are the most sensitive and fastest
temperature measurement devices.
 Thermistors can be used for small range of
temperatures
 Thermistors are non-linear .
68
PROPERTIES OF THERMISTORS
 Because the resistance become too high at
low temperature, the low limit is -1000C
 Because the semiconductor can melt or be
deteriorated at high temperatures, the high
limit is 3000C
 In most cases, the thermistor is encapsulated
in plastic , epoxy, Teflon or some other
material to protect the thermistor from the
environment
69
THERMISTOR’ S LIMITATIONS
 Thermistors have a fast output and are
relatively inexpensive but are fragile and
have a limited range. They also require
a current source and do experience
more self heating than an RTD and are
nonlinear.
ADVANTAGES & DISADVANTAGES OF
THERMISTORS
70
THERMOCOUPLES
71
 When a pair of dissimilar metals are joined together
for the purpose of measuring temperature, the device
formed is called a thermocouple.
 Thermocouples for instrumentation use metals of
high purity for an accurate temperature/voltage
relationship (as linear and as predictable as possible).
 Thermocouples cover a range of temperatures from
-2620C to 27600C
72
DEFINITION OF THERMOCOUPLES
73
THERMOCOUPLE
 Thermocouples suffer from 2 major problems that
cause errors when using them
1) Small voltage generated
EX: 10C temperature change on a platinum
thermocouple results of an output change of 5.8 μV
2) the non-linearity that requires polynomial
conversion
74
PROBLEMS OF THERMOCOUPLES
 The voltage (emf) produced by a heated junction of
two wires is directly proportional to the temperature.
 This fairly linear relationship is called SEEBECK EFFECT
 Thus, the Seebeck effect provides for us an electric
method of temperature measurement
 RTD’S AND THERMISTORS USE RESISTANCES FOR
MEASUREMENT BUT THERMOCOUPLES USE VOLTAGE
75
SEEBECK EFFECT
ε = α. ( T2-T1)
WHERE:
ε= THE EMF
TYPES OF THERMOCOUPLES
α = SEEBECK COEFFICIENT
T2 ,T1= JUNCTION TEMPERATURE IN K
76
SEEBECK COEFFICIENT
 K = Chromel-alumel
Temperatures : -190 to 13710C
Seebeck Coefficient= 40 μV/0C
J = Iron-constantan
Temperatures : -190 to 7600C
Seebeck Coefficient= 50 μV/0C
77
TYPES OF THERMOCOUPLES
 T = Copper-constantan
Temperatures: -190 to 7600C
Seebeck coefficient : 50 μV/0C
E = Chromel-constantan
Temperatures : -190 to 14720C
Seebeck coefficient: 60 μV/0C
78
TYPES OF THERMOCOUPLES
 S= Platinum- 10% Rhodium/Pt
Temperatures: 0 to 17600C
Seebeck Coefficient: 10 μV/0C
R = Platinum-13%Rhodium/Pt
Temperatures: 0 to 16700C
Seebeck coefficient : 11 μV/0C
79
TYPES OF THERMOCOUPLES
 Thermocouples are inexpensive, rugged, and
have a fast response time but are less
accurate and the least stable and sensitive.
Thermocouples also read only relative
temperature difference between the tip and
the leads while RTD's and thermistors read
absolute temperature.
ADVANTAGES AND DISDVANTAGES
OF THERMOCOUPLES
80
Temperature
Measurement
Comparison Chart
Criteria Thermocouple RTD Thermistor
Temp Range -267°C to 2316°C -240°C to 649°C -100°C to 500°C
Accuracy Good Best Good
Linearity Better Best Good
Sensitivity Good Better Best
Cost Best Good Better
COMPARISON BETWEEN THE
DIFFERENT TEMPERATURE SENSORS
Temperature Measurement Comparison Chart
81
Find the seebeck emf (ε) for a
thermocouple J with α. = 50 μV/0C
if the junction temperatures are 20
and 1000C
82
CLASS WORK
 Objective of the lab:
I) During the experiment: Reading of the temperature of the water being
heated and the corresponding values for the three temperature sensors.
II) After the lab, draw the three different calibration curves and find the
sensitivity factor α for each sensor using the corresponding formula.
 RTD = Resistance vs. Temperature
 Thermistors: Resistance vs. temperature
 Thermocouples = Voltage vs. Temperature
 III) Write a lab report
LAB #2
TEMPERATURE SENSORS
83
EX: CALIBRATION CURVE OF
THERMOCOUPLE
84
Explain theory and apply the principles of
pressure measurement and select the
appropriate sensor for the application and
discuss technical issues including
calibration.
L.O #3
85
PRESSURE MEASUREMENT
CONTROL & SAFETY
86
 Pressure is the second most important
measurement in process control
 Pressure is controlled for process reason but
also for safety reason.
 The most familiar device are manometers and
gauges but they require a manual operator
87
IMPORTANCE OF PRESSURE
DEFINITION OF PRESSURE
 PRESSURE IS THE AMOUNT OF FORCE EXERTED ON
A UNIT AREA OF A SUBSTANCE:
A
F
P 
88
 P= Pressure
 PI= Pressure Indicator
 PT= Pressure Transmitter
 PC= Pressure controller
 PRC= Pressure Recorder & Controller
 PCV= Pressure Control Valve
 PSV= Pressure Safety Valve
 PRV= Pressure Relief Valve.
TAG DESCRIPTORS FOR PRESSURE
 SI UNITS:
1Pa = 1N/M2=1KG/S2.M
1ATM (ATMOSPHERIC PRESSURE)= 1.01x10⁵ Pa
1 ATM= 101 kN/M2
1ATM= 760 MM. HG
 US UNITS:
1PSIA = 1LBF/IN2
1PSIA = 6894.7 Pa
1ATM= 14.696 PSIA
90
UNITS OF PRESSURE
 STATIC PRESSURE IS FOR A FLUID WITH IS NOT IN
MOTION
EX: FLUID IN A TANK
 DYNAMIC PRESSURE IS FOR A FLUID IN MOTION IN
PIPES
91
STATIC VS DYNAMIC PRESSURE
 P= F/S
 F= m.g
 P= mg/S = (mgxh)/ (Sxh)
=( mgh/V)
m/V= ρ
 P= ρ.g.h
92
Hydrostatic or Static pressure
 THE PRESSURE OF A FLUID IN A PIPE IS MEASURED
BY A PRESSURE GAUGE.
 FLOW CALCULATED BY BERNOUILLI EQUATION
93
DYNAMIC PRESSURE
 IT IS EXTREMILY IMPORTANT TO MAKE THE
DIFFERENCE BETWEEN THE ABSOLUTE AND
RELATIVE PRESSURE
 THE ABSOLUTE PRESSURE IS THE REAL
PRESSURE OF THE FLUID WHERE THE
RELATIVE PRESSURE IS THE PRESSURE WE
READ IN A PRESSURE INDICATOR WITH
REFERENCE THE ATMOSPHERIC PRESSURE
94
ABSOLUTE AND GAUGE PRESSURE
 PA = PG + 1 ATM
 EXAMPLE #1 :EXPRESS A PRESSURE GAUGE OF 155
KPa TO ABSOLUTE PRESSURE WHEN THE
ATMOSPHERIC PRESSURE IS 98 Kpa
 EXAMPLE #2: WHICH PRESSURE DO YOU READ IN A
GAUGE MANOMETER FOR A PRESSURE OF 225 KPa (
ABSOLUTE ) WHEN ATMOSPHERIC PRESSURE IS 101
KPa
95
RELATIONSHIP BETWEEN PA AND PG
CLASS WORK
In many cases, gauge pressure is more
important than the absolute pressure
because we read gauge pressure in
manometers.
 Pg= Pabs- Patm
96
GAUGE PRESSURE
PRESSURE INDICATORS
97
 PRESSURE IS USUALLY MEASURED FOR INDICATION
ONLY BY READING:
 GAUGES
 U TUBES
98
PRESSURE INDICATORS
 A hard metal tube ( bronze or brass) is
flattened and one end is closed. Under
pressure, the tube is bent into a curve or arc.
 The open end is attached to a header by
which the pressure can ne introduced inside
the tube
99
MANOMETER= GAUGE OR BOURDON TUBE
100
PRESSURE INDICATORS IN PLANTS
101
U-TUBES
I) A tank open to atmosphere holds water with a
depth of 7 m. Density of water = 1000 kg/m3
a) What is the pressure in a gauge at the bottom of
the tank in Pa ?
b) Draw the figure showing the manometers
readings
102
CLASS WORK
 in a closed tank under vacuum, the bottom pressure of an unknown
liquid at 1.2 m depth is 12.55 kPa (absolute).
 1) Draw a figure showing the manometer readings
 2) What is the density of the fluid?
 A crude oil, in a tank at 60 kPa top absolute pressure, has a specific
gravity of 0.89 and a pressure of the bottom of 345 kPa ( gauge).
 1) Draw a figure showing the manometer readings
 2) What is the level of the oil in the tank ?
 A fluid in a tank has a specific gravity of 0.76 and a absolute pressure
at the top 150 kPa and a gauge pressure at the bottom of 140 kPa.
 1) Draw a figure showing the manometer readings
 2) What is the level of liquid in the tank?
HOMEWORK
103
 CALIBRATION OF A MANOMETER BY MEASURING THE
PRESSURE OF A GIVEN WEIGHT USING A HYDRAULIC
OIL
 USE DIFFERENT WEIGHTS
READ THE PRESSURES IN THE MANOMETER
 APPLY THE FORMULA (P=m.g/S)
COMPARE the reading with the calculated PRESSURE and
calculate the error
104
LAB #3 :
calibration of manometers
LEVEL MEASUREMENT
105
Explain theory and apply the principles of level
measurement and select the appropriate
sensor for the application instruments and
discuss technical problems including
calibration.
L.O #4
106
In any chemical plant, you will find tanks,
reservoirs, vessels and drums where liquids
are stored. These could be for:
The feed of the plant
Intermediate between sections
The products before selling them
Liquid capacities are also found in distillation
columns and reactors
107
LIQUID CAPACITIES IN A CHEMICAL PLANT
Level of liquid in a vessel should be maintained above the exit
pipe because if the vessel empties the exit flow will become
zero, a situation that could damage PUMPS.
A minimum level of liquid is then necessary to avoid
cavitation of the pump
This minimum should be known (measured) and respected
during the production
108
MINIMUM LEVEL
 The level should also have a maximum value to:
 not overflow an open vessel (safety for workers)
 should not exit through a vapor line of a closed
vessel, which could disturb a process designed for
vapor ( safety for COMPRESSOR , TURBINES)
109
MAXIMUM LEVEL
 L= Level
 LI= Level Indicator
 LT= Level Transmitter
 LC= Level controller
 LRC= Level Recorder & Controller
 LCV= Level Control Valve
 LLA and VLLA: Low level Alarm and Very…
 HLA and VHLA: High Level Alarm and Very..
TAG DESCRIPTORS FOR LEVEL
110
 Level measurement sensors are divided into two
categories:
 point level switches for ALARMS
 continuous level gauges for CONTROL
111
LEVEL MEASUREMENT SENSORS
 Point level is used mostly for SAFETY.
 Will operate when the liquid is above or below a
certain point.
 Switches devices indicate when a vessel is full, empty
or at intermediate level
 You will have LLA ( low level Alarm) and HLA ( high
level Alarm)
112
POINT LEVEL SWITCHES
Continuous level gauges provide information
about material level at all points in the vessel
Continuous level gauges are used for control
purpose
113
CONTINUOUS LEVEL GAUGES
 Pressure ( hydrostatic)
 Float
 Nuclear
 ultrasonic
114
SENSORS FOR CONTINUOUS LEVEL
MEASUREMENT
 Float
 Capacitance
 Conductive level probes
 Thermal & light beam
115
SENSORS FOR POINT LEVEL MEASUREMENT
116
ULTRASONIC SENSOR
(NO-CONTACT)
 The differential pressure is the most commonly used for
continuous level measurement of liquids.
 a membrane is used where the value
 H(Level)= ΔP/ρ.g
117
LEVEL MEASUREMENT BY HYDROSTATIC
PRESSURE
118
TANK OPEN TO ATMOSPHERE
119
TANK UNDER PRESSURE OR VACUUM
 A tank open to atmosphere holds water. The pressure
at the bottom is 200 kPa ( absolute)
1) Draw the figure showing the tank and the
differential pressure ’s reading
2) What is the level in the tank ?( density of water =
1000 kg/m3)
 In a closed tank under vacuum and containing crude oil
( ρ= 780 kg/m3) , the bottom pressure is 12.55 kPa
(absolute).
1) Draw a figure showing the tank and the differential
pressure ’s reading.
2) What is the level in the tank?120
Class Work
 A crude oil, in a tank at 120 kPa top absolute pressure, has a
specific gravity of 0.80 and a gauge pressure of the bottom of
345 kPa .
1) Draw a figure showing the tank and the differential pressure s
reading.
2) What is the level in the tank?
 A fluid in a tank has a specific gravity of 0.65 and a gauge
pressure at the top 150 kPa and a absolute pressure at the
bottom of 140 kPa.
1) Draw a figure showing the tank and the differential pressure
’s reading.
2) What is the level of liquid?
HOME WORK
121
FLOW MEASUREMENT
122
Explain theory and apply the principles of
flow measurement and select the
appropriate sensor for the application and
discuss technical problems including
calibration.
L.O #5
123
 Quantity of fluid flowing in a system by unit time.
 This quantity can be expressed in three ways:
 Volume Flow rate ( Q) :Bring a flask and a stop watch
to measure volumetric flow
Mass Flow rate ( M)
 Weight Flow rate ( W)
124
WHAT IS FLOW?
F= Flow
FI= Flow Indicator
FT= Flow Transmitter
FC= Flow controller
FRC= Flow Recorder & Controller
FCV= Flow Control Valve
TAG DESCRIPTORS FOR LEVEL
125
 If we know the volume flow rate Q, we can calculate
the mass flow rate by : M=ρ.Q
 If we know the volume flow rate Q, we can calculate
the weight flow by : W=γ.Q
126
RELATIONSHIP BETWEEN FLOWS
 The volume flow rate is the volume of fluid
flowing past a section per unit time
 In a pipe, we can have the relation: Q=A .v
(where v is the average velocity of flow)
 Units used:
SI : EX: v (m /s)  Q (m3/s)
US : EX: v (ft /s)  Q(ft3/s)
127
Volume flow rate Q
 An average flow rate of water produced by a
plant is 11600 m3 /hr. Find the equivalent flow
rate in m3/s, mass flow rate in kg/s ( density of
water = 1000 kg/m3) and the weight flow rate (
Weight= Mass x gravity) and gravity = 9.8 m/s2
128
CLASS WORK (units)
 A) MATERIAL BALANCE OF A PLANT: VERY
VERY IMPORTANT
 Measure flow of feeds
Measure flow of products
We should have : IN=OUT in mass ( Otherwise
we have leaks in the plant)
 B) FLOW IS A IMPORTANT VARIABLE FOR THE
SYSTEM ( EX:REACTOR)
 WHEN YOU HAVE A RATIO CONTROL SYSTEM
129
WHY WE NEED TO MEASURE FLOWS
 In the instrumentation market, we find two types of
flow-meters:
 Energy-extractive Flow meters
Energy additive Flow meters
130
FLOW MEASUREMENT TECHNIQUES
 Several sensors rely on the pressure drop or head
occurring as a fluid flows by a resistance.
131
THE PRINCIPLE OF FLOW SENSORS
 ORIFICE
 VENTURI TUBE
 FLOW NOZZLE
 ELBOW METER
 PITOT TUBE
 TURBINE
132
MOST IMPORTANT FLOW SENSORS
Bernouilli Equation
 Old system : use low measurement devices that reduce the energy of the system.
The differential pressure is used to measure flow using Bernoulli equation:
 Applying Continuity equation: QA=QB ( assuming constant density). Find the
relationship between flow ( You want to estimate) and ΔP ( your readings).
 this relationship is used in Energy extractive flow meters as a conversion factor
22
2
1
2
1
BB
B
AA
A
v
g
z
p
v
g
z
p


133
 From Bernouilli Equation:
 𝑄 = ∆𝑃.
2( 𝐴1.
2 𝐴2
2 )
𝜌(𝐴1
2 −𝐴2
2)
Pressure drop in Pa
Area in m2
Density in kg/m3
Q in m3/s
Calculating volumetric flow rate Q
134
 In a pipe of 0.3 diameter, water is flowing at
600C. We use a venturi tube to measure the
flow rate. The venturi tube has a diameter of
0.2 m and we observe a pressure drop of 50
pa
 What is the volume flow rate and the
conversion factor?
 What is the mass flow rate?
135
CLASS WORK
PROCESS CONTROL
136
 Define the terms used in chemical process control and discuss the role
and importance of process control systems in industrial plants.
 Define P, PI and PID controllers
 Explain feedback control and the dynamic behavior of this controller.
 Apply the principles of feed-forward and show how this type of control
can be applied.
 Describe how the principles of cascade control, ratio, the selective
control and split - range control are used in processes control.
 Define the principles of computer control and distinguish between
direct digital control and supervisory control.
 Do experiments and write laboratory reports in a professional manner.
PART II: PROCESS CONTROL
137
L.O #1
Define the terms used in
chemical process control and
discuss the role and importance
of process control systems in
industrial plants.
138
139
THE SEVEN OBJECTIVES OF A CONTROL SYSTEM
• 1. Safety
• 2. Environmental Protection
• 3. Equipment protection
• 4. Smooth Operation and production rate
• 5. Product Quality
• 6. Profit
• 7. Monitoring and Diagnosis
Example
 Heating up the temperature in the tank is a
process that has the specific, desired outcome to
reach and maintain a design value for the
temperature (e.g. 80°C), kept constant over time.
 The desired temperature (80°C) is the set point.
The controller will manipulate the valve of hot
water to maintain the room temperature at 800C.
140
141EXAMPLE OF CONTROL SYSTEM
142WHAT ARE THE DESIGN VALUES?
 THE DESIGN ENGINEERS CALCULATE THE VALUES
OF SOME VERY IMPORTANT VARIABLES OF THE
PROCESS THAT SHOULD BE MAINTAINED
CONSTANT IN ORDER TO GIVE MAXIMUM
PROFITABILITY BY RESPECTING SAFETY AND
ENVIRONMENT ( OPTIMIZATION)
 THESE CALCULATED VALUES ARE THEN
INTRODUCED AS SET POINTS ( VALUES TO BE
RESPECTED) IN THE CONTROLLER ONCE THE
PLANT IS BUILT .
143
HOW ARE THE VALUES OF THE IMPORTANT VARIABLES (
SET POINTS) MADE CONSTANT?
ACTING ON SOME OTHER LESS IMPORTANT
VARIABLES OF THE PROCESS IN ORDER TO
SUPPRESS THE EFFECTS OF EXTERNAL
DISTURBANCES ON THE IMPORTANT
VARIABLES
Examples for Process
Automation
144
Overview of Process Automation
The process is “that portion of an automation
operation which use energy measurable by some
quality such as pressure, temperature, level, flow,
(and many others) to produce changes in quality or
quantity of some material or energy.”
PROCESS
Some Quality or Quantity
of the
Material or Energy
Input
Energy
or
Material
Desired
Result
Example of a Temperature Process
Heating Element
Water Bath
Temperature
The objective of this process is to maintain a
constant water bath temperature.
Temperature Process Terminology
Heating Element
Water Bath
Temperature
This is a Temperature Process
The measuring means is the thermometer. (Temperature Indicator- TI)
The process temperature is maintained at a desired point (Set Point – SP)
Steam (Control Agent) is used to vary the temperature by opening and closing the
control valve (Final Control Element)
Level Process
Oil Stock
Level Indicator
Oil Feed to
next
process
The control objective is to maintain a constant liquid
level of oil inside the tank (e.g. 100 gallons +/- 20
gallons). The hand valve is opened and closed as
required to maintain the desired tank level.
Terminology used to describe the process
 PROCESS: Level
 CONTROLLED VARIABLE: Level by Head pressure at bottom of tank
 CONTROL POINT: The level of oil in the tank (Set Point = 100 gallons)
 MEASURING MEANS: Level Indicator (Head Pressure)
 MANIPULATED AGENT: Volume of oil stock
 MANIPULATED VARIABLE: Flow rate of oil (gpm)
Oil Stock
Level Indicator
Oil Feed to
next
process
Basic Model of a Process
The process is maintained at the desired point (SP) by
changing the FCE based on the value of the PV
Manipulated
Variable
Desired
Result
Control
Agent
PROCESS
(Temperature,
pressure, level, flow)
FINAL
CONTROL
ELELMENT
(valve)
Measuring
Means
(transmitter)
Process Variable (PV)
Controlled
Variable
Actuating
Input
pH, conductivity, humidity,
density, consistency, etc.
Process equilibrium (balance) is when the input energy maintains the
output at a constant “desired” point.
Basic Model of a Process
The measuring means provides the
standardized signal that represents the
condition of the process, i.e. is the process
at the desired point?
Manipulated
Variable
Desired
Result
Control
Agent
PROCESS
(Temperature,
pressure, level, flow)
FINAL
CONTROL
ELELMENT
(valve)
Measuring
Means
(transmitter)
Process Variable (PV)
Controlled
Variable
Actuating
Input
pH, conductivity, humidity,
density, consistency, etc.
Review of Measuring Means
Pressure
Level
Flow
Temperature
Thermocouples
RTDs / Thermistors
Filled Systems
Bi-metallic
Strain gauge
Piezo-electric
Capacitance
Bourdon Tube
Head meters
(orifice, venturi)
Coriolis, velocity,
Mass,
Mechanical Floats
Guided Wave
Weight (load cell)
Ultrasonic
Differential Pressure
Transmitters
Pressure Transmitter
Level Transmitter
Differential Pressure Cell
Flow Transmitter
Temperature Transmitter
Pneumatic
3-15 PSI
Electrical
Current
4 – 20 mA
0 – 20 mA
10 – 50 mA
Voltage
0 – 5 V
1 – 5 V
0 – 10 V
Digital
ON/OFF
Field Bus
ModBus
ProfiBus
HART
Manual Control
Open loop (or manual control) is used when very
little change occurs in the Process Variable (PV)
Manipulated
Variable
Desired
Result
Control
Agent
PROCESS
(Temperature,
pressure, level, flow)
FINAL
CONTROL
ELELMENT
(valve)
Measuring
Means
(transmitter)
Process Variable (PV)
Controlled
Variable
Actuating
Input
pH, conductivity, humidity,
density, consistency, etc.
Corrective action is provided by manual feedback
THE FOUR BASIC STEPS OF A PROCESS
CONTROL SYSTEM
HOW DOES IT WORK?
154
155
THE FIRST STEP: TAKING THE
INFORMATION
 IF WE DO NOT KNOW WHAT IS WRONG, HOW CAN WE CONTROL ?
TAKING INFORMATION OF THE IMPORTANT VARIABLES
( Design Values) OF THE PROCESS.
156IN OUR CASE:
 Temperature of the tank has to be controlled.
 Temperature SHOULD FIRST BE MEASURED.
THE EQUIPMENT FOR temperature
MEASUREMENT IS : thermocouple
157
THE SECOND STEP OF A PROCESS CONTROL SYSTEM:
TRANSMISSION OF THE INFORMATION
 LINK BETWEEN THE PLANT AND THE CONTROL ROOM)
 THE MEASUREMENT OF THE CONTROLLED VARIABLE IS SENT
TO THE CONTROLLER IN THE CONTROL ROOM.
THE EQUIPMENT FOR TRANSMISSION IS THE TRANSMITTER
Thermocouple is also a transmitter
IN OUR CASE:
THE ANALOG SIGNAL OF THE VALUE OF FB (
MEASURED VARIABLE) IS TRANSMITTED TO
A/D CONVERTER
THE RESULTING DIGITAL SIGNAL IS SENT TO
THE CONTROLLER (digital or computer
software)
 WHY A/D CONVERTER?
158
159
THE THIRD STEP :THE CONTROLLER MAKE
DECISION
THE THIRD STEP IS THE CONTROLLER IN THE CONTROL ROOM
 THE CONTROLLER:
1) RECEIVE THE INFORMATION FROM THE PLANT
2) COMPARE IT WITH THE SET POINT
3) CALCULATE THE DIFFERENCE ε BETWEEN THE SET POINT AND
THE INFORMATION.
4) MAKE A DECISION FOR ACTION TO BE TAKEN IN THE PLANT.
IN OUR CASE:
THE CONTROLLER WILL FIRST COMPARE T (
MEASURED VARIABLE) TO ITS SET POINT TSP.
 THE CONTROLLER WILL THEN CALCULATE
THEIR DIFFERENCE ε =( TSP-T)
 THIS DIFFERENCE ε IS MULTIPLIED BY A
FACTOR K DEPENDING ON THE TYPE OF
CONTROLLER ( P,PI OR PID TO BE STUDIED
LATER)
160
161
THE FOURTH STEP: ACTION ON A CONTROL VALVE OR
MOTOR IN THE PLANT
A SIGNAL FROM THE CONTROLLER, RELATED TO
THE DIFFERENCE ε IS SENT TO THE VALVE TO
MANIPULATE THE FLOWRATE OF STEAM WHICH
IS A LESS IMPORTANT VARIABLE
THE VALVE IS THE FOURTH AND LAST
EQUIPMENT OF THE PROCESS CONTROL SYSTEM
 THE FLOW OF STEAM IS THE MANIPULATED
VARIABLE.
162IN OUR CASE
 TO ELIMINATE THE EFFECTS OF THE SURRONDINGS (
DISTURBANCES) ON THE IMPORTANT VARIABLE
TEMPERATURE WHICH IS MEASURED
 TO BRING T AS CLOSE AS POSSIBLE TO ITS SET POINT
VALUE TSP THE CONTROLLER ACT ON ANOTHER
VARIABLE FA CALLED MANIPULATED VARIABLE
163BLOCK DIAGRAM OF A PROCESS CONTROL SYSTEM
CLASS WORK
 We want to produce ammonia from nitrogen and
hydrogen in a reactor where the temperature should
be maintained constant by a coolant in a jacket
around the reactor.
 Draw the process
 Draw the process control system
 Show the FOUR steps of the control loop
164
THE DIFFERENT CONTROL
ACTIONS
165
EXAMPLE OF OPEN LOOP SYSTEM : SYSTEM WITH NO CONTROL
level
LISTEN..LEARN..THINK..ENJOY YOURSELF
166
166
LEVEL WITH SET POINT BUT NO CONTROL
 LEVEL2
LISTEN..LEARN..THINK..ENJOY YOURSELF
167
167
A SYSTEM WITH CONTROL
CLOSED LOOP
168
169A) MANUAL CONTROL
 DURING START UP AND SHUT DOWN: OPERATOR CONTROL THE
PLANT OPERATIONS
 LEVEL3
170
AUTOMATIC CONTROL
 DURING OPERATING CONDITIONS: THE CONTROLLER TAKES
ACTIONS
 ON AND OFF CONTROLLER:
 CONTROLLER TAKES ACTION ONLY WHEN THE MINIMUM AND THE MAXIMUM
OF THE LEVEL ARE REACHED
 NOT USED VERY OFTEN ONLY IN SIMPLE SITUATIONS WHEN SAFETY AND
PRODUCTIVITY ARE NOT AFFECTED
 LEVEL4
171CONTINUOUS AUTOMATIC CONTROL:
 THE MOST USED CONTROLLERS:
PROPORTIONAL ( P)
 PROPORTIONAL- INTEGRAL ( PI)
 PROPORTIONAL-INTEGRAL-DERIVATIVE ( PID)
172CONTROL SYSTEM: P,PI,PID
 CHANGE THE SET POINT OF THE LEVEL AND OBSERVE THE
BEHAVIOR OF THE PROCESS
 LEVEL5
THE DIFFERENT FUNCTIONS OF A PROCESS
CONTROL LOOP
Between the measuring device and the final control
element, we have different steps and each step has its
own function
 THE SENSOR : the output ym(t) of the sensor is related to
the real value in the controlled variable y (t) by a transfer
function
 THE TRANSMITTER : The value yt (t) entering the
controller is related to ym(t) by a transfer function ( we
have delay in the information)
LISTEN..LEARN..THINK..ENJOY YOURSELF
173
173
DIFFERENT FUNCTIONS
 THE CONTROLLER : after comparing to the set point ySP ,
the input to the controller is then ε (t) = ySP- ym(t). The
output c(t) is related to
ε (t) by a transfer function of the controller (P,PI,PID)
The way c(t) and ε (t) are related depends on the type of
controller ( TO BE STUDIED LATER)
 THE VALVE: The output signal of the valve is related to
c(t) by a transfer function depending on the type of the
valve
LISTEN..LEARN..THINK..ENJOY YOURSELF
174
174
Lab #4:Demonstration lab
 Demonstration lab for the pressure controller
including:
 1) The four steps
 2) Converters P/I , I/P for electronic Controllers
 3) A/D and D/A converters for digital controllers
175
VIDEO FOR BASIC STEPS
176
Closed Loop Control
Closed loop or feedback control provides a corrective
action based on the deviation between the PV and the
SP
Automatic
Controller Output
(3-15 psi, 4-20mA etc)
CONTROLLING
MEANS
Manipulated
Variable
Desired
Result
Control
Agent
PROCESS
(Temperature,
pressure, level, flow)
FINAL
CONTROL
ELELMENT
(valve)
Measuring
Means
(transmitter)
Controller Input (PV)
(3-15psi, 4-20mA etc)
Controlled
Variable
pH, conductivity, humidity,
density, consistency, etc.
Manual
SP
Controlling Means
Controllers provide the required control action
to position the FCE at a point necessary to
maintain the PV at the desired SP.
PID (single loop feedback controller)
DCS (distributed controllers)
PLC (programmable logic controllers)
Single Loop Feedback Control
1. Measuring Means
2. Controlling
Means
3. Final Control
Element
4. Temperature
Process
Temperature Controller and
Recorder
Sensing
Bulb
Temperature
Transmitter
Pneumatic
Control Valve
Heat Exchanger
Steam
2
3
4
1
The TT provides the signal (PV) that represents the condition
of the process being controlled. The TIC compares the PV to
the SP and opens and closes the FCE to maintain the process
at equilibrium.
Summary
 Process automation makes use of instrumentation to maintain the
process at some desired condition.
 Common instrumentation used in a process loop are the
measuring means (usually transmitters), the controlling means
(usually a PID controller), and the Final Control Element (usually
some type of valve)
 The measuring means provides the feedback signal (PV) used in
the process loop. The controlling means operates the FCE based
on the difference between the PV and the SP.
 Process equilibrium is maintained when the difference between
the PV and SP is zero or constant (offset?)
NEXT?
What are
transmitters?
What is PID? What are P&ID
symbols?
What types
of FCE are
there?
What am I
doing here?
How do I
measure?
Pressure
Level
Temperature
Flow
How do I
tune a loop?
What is
Integral
action?
What is a?
FIC
TT
LRC
PRV
Should I use a
3-15 psi or 4-
20 mA valve?
Check out
TRANSMITTERS, TRANSDUCERS
AND CONVERTERS
182
 In the context of industrial process control, a
"transmitter" is a device that converts sensor
measured units into an electrical signal then directs
this data (via cabling or wirelessly) to be received by a
display or instrumentation control device within the
system.
183
Transmitters
 Analog transmitters are the most commonly used
type in most industrial sectors. The transmitter is
connected to the rest of the system via 2 wires which
create something know as the 'current loop.'
 The two wires can be used for both powering the unit
and for transmitting signals typically at a range of 4
mA to 20 mA
184
Analog Transmitter
 In an increasing number of industrial situations wireless sensors
are an appropriate upgrade to classic industrial transmitters.
This is because current of generation sensors offer flexible
system solutions which are ideal for temporary installations and
in processes with moving parts/objects.
 Such wireless sensor networks can be comprised of hundreds
or thousands of intelligent sensors. This allows for complex
network mapping that can provide advanced solutions to
today's processing environments.
185
Wireless transmitters
 If the measuring device is pneumatic and the
controller is electronic: A P/I transducer is needed to
transform a physical movement into electrical
current.
 The I/P transducer does the opposite direction but
not very used because most controllers are now
electronic or digital.
186
Transducers: P/I and I/P
If the controller is digital and the measuring device is pneumatic, we
need:
 1) convert pneumatic into electrical by P/I transducer
 2) convert electrical to digital using A/D converter.
At the exit of the digital controller we need:
 1) D/A is the valve is electrical
 2) D/A + I/P is the valve is pneumatic
187
Converters: A/D and D/A
Define P, PI and PID controllers
L.O #2: CONTROLLERS
188
CONTROLLERS
THE HEART OF PROCESS
CONTROL LOOP
189
 P CONTROLLER IS PROPORTIONAL CONTROLLER
 PI CONTROLLER IS PROPORTIONAL CONTROLLER
WITH INTREGRAL ACTION
 PID CONTROLLER IS PROPORTIONAL CONTROLLER
WITH INTEGRAL ACTION AND DERIVATIVE ACTION.
DIFFERENT KINDS OF CONTROLLERS
190
PROPORTIONAL CONTROLLER
The proportional CONTROLER means that the
controller output c(t) is linearly related to the
error ε (t)
The proportional controller has a gain Kc or
Proportional Band (PB) related by the formula
(Kc= 100/PB)
LISTEN..LEARN..THINK..ENJOY YOURSELF
191
191
Chapter 15 - Process Control Methods 192
Proportional Band
 Proportional band is defined as the percentage
change in the controlled variable that causes the
final correcting element to go through 100
percent of its range
PB =
Controlled Variable % Change
FinalCorrecting Element % Change
PROPORTIONAL ACTION
 The proportional action means that the controller output
c(t) is linearly related to the error between set point (SP)
and measurement of process output ym (t) :
c(t) = Kc .ε(t) = Kc (SP – ym(t) )
 The proportional gain Kc of a analog controller can be
adjusted by knob in the controller.
 Direct or reverse actions ?
LISTEN..LEARN..THINK..ENJOY YOURSELF
193
SIGN OF THE GAIN KC
If he controller is direct acting  the
gain K is positive.
When the controller is reverse acting 
the gain K is negative
LISTEN..LEARN..THINK..ENJOY YOURSELF
194
PROPORTIONAL BAND
 Proportional controllers are defined by their Proportional Band
(PB) or the proportional gain (Kc)with PB =100/Kc
 For pneumatic valves, we define Kcp which is the output from the
controller to the valve. The range of the instrumentation pressure
for pneumatic valves is 3 -15 psia.
 For electrical valves, we define Kce which is the output from the
controller to the valve. The range of the instrumentation current
for electrical valves is 4-20 mA.
LISTEN..LEARN..THINK..ENJOY YOURSELF
195
DIFFERENT SITUATIONS:
 A) IF A FULL CHANGE IN THE CONTROLLED VARIABLE IS
ALSO A FULL RANGE FOR THE VALVE , WE WILL HAVE:
PB= 100%/100%= 1= 100% ,KC=1
 IF WE ARE CONTROLLING TEMPERATURE FOR A RANGE
OF 60-100, WE WILL HAVE : Kcp = 0.3 PSIA/ DEGRE
LISTEN..LEARN..THINK..ENJOY YOURSELF
196
 B) IF A 10% CHANGE IN THE CONTROLLED VARIABLE
GIVES A FULL RANGE IN THE 100% IN THE VALVE, WE WILL
HAVE PB= 10%/100% = 10%
IF WE CONTROL TEMPERATURE FOR THE SAME TOTAL
RANGE, 10% WILL BECOME 4 DEGRE AND WE WILL HAVE
Kcp= 3PSIA/DEGRE
THE CONTROLLER IS MORE SENSITIVE
LISTEN..LEARN..THINK..ENJOY YOURSELF
197
 C) IF A 100% CHANGE IN THE CONTROLLED VARIABLE
GIVES A 20% RANGE IN THE VALVE, WE WILL HAVE PB=
100%/20% = 500%, KC=0.2
IF WE CONTROL THE SAME TEMPERATURE , WE WILL
HAVE Kcp= 0.06 PSIA/DEGRE
THE CONTROLLER IS LESS SENSITIVE
LISTEN..LEARN..THINK..ENJOY YOURSELF
198
EXAMPLE #1
 Let’s consider a control system for a temperature in a process where the output of the
controller is a pressure signal to the final element or valve.
 The controller is used to control temperature within the range of 600F to 1000F.
 The controller is adjusted so that the output signal varies from 3 psi (valve fully open) to
15 psi (valve fully closed) as the controlled temperature (measured) varies from 710F to
750F.
Fpsi
FF
psipsip
Kcp
0
00
/3
)7175(
)315(








%10100.
)60100(
)7175(
00
00




FF
FF
PB
LISTEN..LEARN..THINK..ENJOY YOURSELF
199
EXAMPLE #2
 Now, if we consider a PB of 75% for the same range of 600F to 1000F, what will
be the Gain Kc?
 From the PB formula, we find ΔT ( the change of the measured variable)
 From the Gain formula:
FFrangePBT 00
30)40.(75.0. 
Fpsi
F
psipsi
Kcp
0
0
/4.0
30
)315(



LISTEN..LEARN..THINK..ENJOY YOURSELF
200
OFFSET OF PROPORTIONAL CONTROLLER
 An important characteristic of a proportional controller is the
OFFSET
 In a proportional controller, there is always a residual error of the
controlled variable.
 It can be minimized by a large Kc which also reduce the PB
 See figure 9-10 page 198
LISTEN..LEARN..THINK..ENJOY YOURSELF
201
EXAMPLES OF USES OF A PROPORTIONAL
CONTROLLER
 Proportional controllers are mostly used for level control
where variations of the controlled variables carry no
economical and where others control modes can easily
destabilize the loop
 It is actually recommended for controlling the level of a
surge tank when manipulating the flow of the feed to a
critical downstream process.
LISTEN..LEARN..THINK..ENJOY YOURSELF
202
CHARACTERISTICS OF
PROPORTIONAL CONTROLLER
 Relationship between the output c(t) and error ε (t) is:
 c(t) = Kc .ε(t) = Kc .ε(t)
 Proportional Controller gives always an Off-Set, which is a
difference between the controlled variable and set point.
 A proportional controller will have the effect of reducing
the rise time but never eliminate THE OFF SET
 Increasing the gain or decreasing the PB will eliminate
decrease off set but gives fluctuations
203
 We can reduce the off set by increasing the gain BUT if the gain
is too high, the controller become too sensitive and we will
experience fluctuations and instability.
GAIN AND OFF SET
204
Selecting the Right
Proportional band
or PB
That bit was the
“hard part” to
understand...
But it is not so difficult
to understand if we
take a look at what it
does in the actual
application... 205
PB too small
C°
(t)
SV
PB correct
C°
(t)
SV
PB too large
C°
(t)
SV
A Proportional Band that is too narrow causes
hunting! The TC will than behave like an ON/OFF
controller!
A correctly sized P-Band results in an Overshoot,
followed by an Undershoot and than Stabilization,
with a small offset near the Set Point.
With a (far) too large P-band the Setpoint temperature
will never be reached! (As the heater capacity will be reduced too much).
This will create a large offset from the Set Point!
P-Action.The right setting of PB is very important !
206
Lets have a look now
what will happen if
we add the PI
controller
That explains the P-Action so far...
The “Integral Action”
207
Chapter 15 - Process Control Methods 208
The need of an Integral Action
 Because of the introduction of offset in a
control process, proportional control alone
is often used in conjunction with Integral
control.
 Offset is the difference between set point
and the measured value after corrective
action has taken place
Chapter 15 - Process Control Methods 209
Integral or Reset Action
 Integral control is also referred to as reset control
as the set point is continuously reset as long as an
error is present
 Integral adjustments that affect the output are
labeled 3 ways:
 Gain - expressed as a whole number
 Reset - Expressed in repeats per minute
 Integral Time - Expressed in minutes per reset
 PI controller is a Proportional controller in which integral
action is added. It has then two constants:
A) PB
B) Integral time
An integral control will have the effect of eliminating the
OFF SET , but it may make the response more oscillatory
and needs longer to settle.
PI OR PROPORTIONAL INTEGRAL
CONTROLLER
210
 The output of the controller is related to the
error ε (t) by the relationship:
 c(t) = Kc { 1+ (1/τi.s) }. ε(t); τi is the integral
time.
 Integral action eliminates the off set but the
response becomes more oscillatory and
needs longer to settle down.
CHARACTERISTICS OF PI
211
 As explained: The I-Action eliminates the Offset, but influences
the whole process from the start ( fluctuations).
 Making the Integral time shorter will give you more intense
control with a quicker response to eliminate the offset. But a
too short Integral time would result in “oscillation” (=hunting) !
 Making the Integral time too long will reduce the possibility of
hunting but will slow down your overall Process response. So
the RIGHT setting is very important.
The right Integral Time
212
The setting of the right I-Time is very important !
0
20
40
60
80
100
120
140
°C
SP
PV @
I=80s
PV @
I=38s
PV @
I=20s
SV:
100o
C
The best way is to explain
with a real control graph :
A too long I-Time slows
down the whole Process
The RIGHT I-Time will
enable the TC to reach
the Setpoint quickly and
to eliminate the Offset
correctly.
Making the I-Time too
short creates a (large)
overshoot. Also takes
a long time to correct:
Example of
behaviour after a
disturbance
213
Lets have a look
now at the PID
controller
Well.. That explains the “P+I Action”...
The “Differential Action”
214
Chapter 15 - Process Control Methods 215
Derivative Action
 For rapid load changes, the derivative mode is typically
used to prevent oscillation in a process system
 The derivative mode responds to the rate of change of
the error signal rather than its amplitude
 Derivative mode is never used by itself, but in
combination with other modes
 Derivative action cannot remove offset
PID or Proportional Integral
Derivative Controller
 PID controller is a PI controller in which the derivative
action is added. It has then three constants:
 A) PB
 B) Integral time : τi
 C) Derivative : τd
 A derivative action will have the effect of increasing
the stability of the system, reducing the overshoot, and
improving the transient response.
216
 The relationship between the output of
the controler and the error ε(t) is c(t) =
Kc { 1+ (1/τi.s) + τd.s }. ε(t); τi is the
integral time and τd is the derivative
time
 All design specifications can be reached.
CHARACTERISTICS OF PID
217
A too long D-Time leads to “excessive”
response!
Than we will Over- and Undershoot the setpoint.
(Far too long D-time will create oscillation, like ON/OFF Controller)
A correctly sized D-Time results in a fast return to
the Set Point. Could be followed by a small
overshoot and than return rapidly to the
Setpoint.
With a too short D-time the Process will behave like a
PI (only) controller, so will have a (too) slow response
to disturbances.
Note: With a setting of D-Time of 0 sec, we will have a PI Controller!
The right setting of the D-Action is also very important !
o
C
o
C
o
C
The value of the D-Time is usually around ¼ of the I-
Time. (For example: if the I-Time is 180sec., than the D-
Time will be 45sec.)
218
CONCLUSION:
These 3 actions combined:
* The “P-Action”
* The “I-Action”
* The “D-Action”
= PID controller.
That was a “tough part” to combine these 3 actions....
219
CL RESPONSE
RISE TIME-
First Time to
reach set
point
OVERSHOOT-
Highest
value/set point
value
SETTLING TIME-
Time to be inside 5%
of set point
OFF SET
Kp Decrease Increase Small Change Decrease
τi Decrease Increase Increase Eliminate
τd Small Change Decrease Decrease Small Change
EFFECTS OF PB, INTEGRAL TIME AND DERIVATIVE TIME ON THE PROCESS
220
Chapter 15 - Process Control Methods 221
Control Mode Summary
The following additional explanation can also help to
understand the actions of the PID-controller:
• The “P-Action” deals with the “present”
Depending on the deviation from the Setpoint:
more or less Output capacity will be given.
• The “I-Action” deals with the “past”
If we have been below setpoint: the Output will be increased.
If we have been above setpoint: the Output will be decreased.
• The “D-Action” deals with the “future”
If the controlled variable is going down: the Output will be increased.
If the controlled variable is going up: the Output will be decreased.
This “combination”, of “Present + Past + Future”,
makes it possible to control the application very well.
222
TUNING THE CONTROLLER
The task of controller tuning is usually left to an
instrument technician with experience in the cause and
effect of process reaction and controller adjustments.
223
224
Usefulness of PID Controls
 Most useful when a mathematical model of the plant is not
available
 Many different PID tuning rules available
 Sources
 K. Ogata, Modern Control Engineering, Fourth Edition, Prentice Hall,
2002, Chapter 10
 IEEE Control Systems Magazine, Feb. 2006, Special issue on PID
control
Proportional-integral-derivative (PID)
control framework is a method to control
uncertain systems

225
Type A PID Control
 Transfer function of PID controller
 The three term control signal
   
  





 sT
sT
K
sE
sU
sG d
i
pPID
1
1
       ssEKsE
s
KsEKsU dip 
1
226
PID-Controlled System
PID controller in forward path
Chapter 15 - Process Control Methods 227
Control Mode Summary
Chapter 15 - Process Control Methods 228
Tuning the Controller
 Fine-tuning is the process to optimize the controller
operation by adjusting the following settings:
 Gain setting (proportional mode)
 Reset rate (integral mode)
 Rate (derivative mode)
 Three steps are taken when tuning a systems
 Study the control loop
 Obtain clearance for tuning procedures
 Confirm the correction operation of the system
components
229
PID Tuning
 Controller tuning---the process of selecting the controller
parameters to meet given performance specifications
 PID tuning rules---selecting controller parameter values
based on experimental step responses of the controlled
plant
 The first PID tuning rules proposed by Ziegler and Nichols
in 1942
 Other resource: K. Ogata, Modern Control Engineering,
Prentice Hall, Fourth Edition, 2002, Chapter 10
Chapter 15 - Process Control Methods 230
Trial-and-Error Tuning
 Does not use mathematical methods, instead
a chart recorder is used and several bump
tests are made in the proportional and
integral modes
 Trial-and-error tuning is very time consuming
and requires considerable experience on the
part of the technician or operator
231
Ziegler-Nichols Tuning Methods
Two formal procedures for
tuning control loops:
Step response of plant
Continuous cycling method
232
PID Tuning---First Method
Start with obtaining the step response
233
The S-shaped Step Response
Parameters of the S-shaped step response
234
The S-Shaped Step Response
 The S-shaped curve may be characterized by two
parameters: delay time L and time constant T
 The transfer function of such a plant may be
approximated by a first-order system with a
transport delay
 
  1


Ts
Ke
sU
sC Ls
235
PID Tuning---First Method
236
Transfer Function of PID Controller Tuned
Using the First Method
237
Ziegler-Nichols PID Tuning---Second
Method
Use the proportional controller to force sustained
oscillations
Chapter 15 - Process Control Methods 238
Continuous Cycling Method
 The continuous cycling method analyzes the
process by forcing the controlled variable to
oscillate in even, continuous cycles
 The time duration of one cycle is called an
ultimate period. The proportional setting that
causes the cycling is called the ultimate
proportional value
 These two values are then used in mathematical
formulas to calculate the controller settings
 For a set point change : set the proportional band to high
value and reduce this value to the point where the system
becomes unstable
 The proportional band that required causing continuous
oscillation is the ultimate value PBu.
 The ultimate periodic time is Pu.
 From these two values the optimum setting can be
calculated. 239
ULTIMATE PROPORTIONAL BAND
Chapter 15 - Process Control Methods 240
Continuous Cycle Calculations
 Proportional only controller
 Proportional Gain
 Kc = Gu x 0.5
KC = proportional gain,
Gu= ultimate gain
 Proportional Band
 PB = Pbu x 2
PB = proportional band
PBu = ultimate proportional band
The frequency of continuous oscillation is the cross over
frequency ωco
Pu= 2Π/ωco
241
Pu = Ultimate period of sustained cycle
242
Graphic method to Find Pu or Pcr
Measure the period of sustained oscillation
243
PID Tuning
244
Transfer Function of PID Controller Tuned
Using the Second Method
Chapter 15 - Process Control Methods 245
Ziegler-Nichols Reaction Curve Tuning
Method
 This method avoids the forced oscillations that are found
in the continuous cycle tuning method
 Cycling should be avoided if the process is hazardous or
critical
 This method uses step changes and the rate at which the
process reacts is recorded
 The graph produces three different values used in
mathematical calculations to determine the proper
controller settings
Chapter 15 - Process Control Methods 246
Reaction Curve Tuning Formulas
CONTROL VALVES
FINAL CONTROL ELEMENT
247
Final Control Elements
These are some devices
the controller operates:
 Pneumatic valves,
 solenoid valves,
 rotary valves,
 motors,
 switches,
 relays,
 variable frequency drives.
 Control valves are valves used to control
conditions such as flow, pressure, temperature,
and liquid level by fully or partially opening or
closing in response to signals received from
controllers that compare a "set-point" to a
"process control variable" whose value is
provided by sensors that monitor changes in
such conditions
249
Definition
 The opening or closing of control valves is usually done
automatically by electrical, hydraulic or pneumatic actuators.
 Positioners are used to control the opening or closing of the
actuator based on electric, or pneumatic signals.
 These control signals, traditionally based on 3-15psi (Pneumatic
Valves), more common now are 4-20mA ( Electrical Valves) for
industry, 0-10V for HVAC systems.
 The introduction of "Smart" systems, HART, Fieldbus
Foundation, and Profibus being the more common protocols.
250
Types of Control Valves
251
Actuator & positioner of a control
valve
 Control valves are used by automated systems to
adjust flow rates.
 The adjustments are dependent on the controlling system's
setup. They can be automated based on sensor data and presets
or manually controlled by an operator at a remote workstation.
 For pneumatic valves, an actuator changes the current from the
controller into pressure.
 The relationship of current and pressure is calculated based on
the process specifications and the equipment used.
 This system will be designed by control vendors or in-house
engineers in most cases.
252
ELECTRICAL OR PNEUMATIC
CONTROL VALVES?
 When an issue develops in a manufacturing process, the control valve
will be designed to move into an open or closed position.
 The safer option is dictated based on the process and the process
stream involved.
For this reason, valves that require energy to be open, are called:
 Air or electricity to open
 Fail-close
 Reverse Acting
The valves that require energy to be closed, are called:
 Air or electricity to close
 Fail-open
 Direct Acting
253
Fail-Open and Fail-Close Valves
Control valves
Reverse acting: Fail-close or Air
to Open
Direct Acting: Fail-Open or Air
to close
254
Fail-open valves will open and continue to allow flow when the
control valve loses energy in a failure situation.
 For example, a valve might fail open to avoid allowing pressure
of non-harmful gas to build up.
 Cooling system control valves will usually fail open, since in
most cases overcooling a system will not harm the equipment.
When a failure causes energy to be lost, fail-close valves will close
to keep streams contained until they can be checked and fixed.
 Toxic streams will almost always fail closed to prevent
contamination.
 Reactor heating streams usually fail closed in order to avoid
feeding energy to runaway reactions.
255
Examples for Fail –open & Fail-close
Valves
256
Flow Characteristics of the Control
Valve
 The relationship between control valve capacity and valve stem
travel is known as the Flow Characteristic of the Control Valve.
 Trim design of the valve affects how the control valve capacity
changes as the valve moves through its complete travel.
 Because of the variation in trim design, many valves are not
linear in nature. Valve trims are instead designed, or
characterized, in order to meet the large variety of control
application needs.
 Many control loops have inherent non linearity's, which may be
possible to compensate selecting the control valve trim.
 The most common characteristics are shown in the next figure.
 The percent of flow through the valve is plotted against valve
stem position. The curves shown are typical of those available
from valve manufacturers.
 These curves are based on constant pressure drop across the
valve and are called inherent flow characteristics.
257
Flow Characteristics
258
Inherent Flow characteristics Curves
 When valves are installed with pumps, piping
and fittings, and other process equipment, the
pressure drop across the valve will vary as the
plug moves through its travel.
 When the actual flow in a system is plotted
against valve opening, the curve is called the
Installed Flow Characteristic.
259
Installed Flow Characteristics
In most applications, when the valve opens, and the resistance
due to fluids flow decreases the pressure drop across the valve.
This moves the inherent characteristic:
 •A linear inherent curve will in general resemble a quick
opening characteristic
 •An equal percentage curve will in general resemble a linear
curve
260
Installed flow Characteristics
VALVES
261
Valve Types
Ball Valve
Butterfly Valve
Gate Valve
Globe Valve
Check Valve
262
Ball Valve
Sphere with a port in a housing, rotate to
expose channel.
 Applications: Flow control, pressure
control, shutoff, corrosive fluids, liquids,
gases, high temp.
 Advantages – low pressure drop, low
leakage, small, rapid opening
 Disadvantages – seat can wear if used for
throttling, quick open may cause hammer263
Ball Valve
264
Gate Valve
Sliding disk, perpendicular to flow
Applications: Stop valves, (not throttling), high
pressure and temp, not for slurries, viscous
fluids
Advantages – low pressure drop when fully
open, tight seal when closed, free of
contamination buildup
Disadvantages – vibration when partially open,
slow response and large actuating force
265
Gate Valve
266
Butterfly Valve
rotating disk on a shaft, in a housing
Low pressure, large diameter lines
where leakage is unimportant
Advantages – low pressure drop, small
and light weight
Disadvantages – high leakage, high
actuation forces so limited to low
pressures 267
Butterfly Valve
268
Check Valves
allows flow in only one direction
Swing valve similar to butterfly except
hinged along one edge rather than rotate
about the diameter, used primarily for
check valves.
269
Check valve
270
Rupture Disk
(not a valve – ruptures at a set
pressure)
271
PROCESS CONTROL SYSTEMS
272
Servo & Regulator Problems
 Two major problems could happen in any plant:
 1) REGULATOR: The most common situation is when a disturbance
appears in the plant. The controller will make correction to bring the
controlled variable to set point.
 2) SERVO: Very often, operators in the control room will have to
change the set point of some controlled variable. How the controller
will bring the controlled variable to the new set point.
 Both situations will be investigated in the labs 5 & 6.
273
LABS #5 & 6
Controlling pressure in a tank using
digital P, PI and PID digital controllers
 Tuning of a P, PI and PID controller to maintain
the pressure in a water tank constant during
servo or regulator situations:
 Lab #5: The main objective of the lab is to
analyze and compare the graphs of the P,PI and
PID controllers.
 Lab #6: Study constants of controllers to avoid
instability in the plant. 274
L.O #3
Explain feedback control and the
dynamic behavior of this controller.
275
276
Driving your car
Sense
Vehicle Speed
Compute
Control “Law”
Actuate
Gas Pedal
 Goals
 Stability: system maintains desired operating point (hold steady speed)
 Performance: system responds rapidly to changes (accelerate to 65 mph)
 Robustness: system tolerates perturbations in dynamics (mass, drag, etc)
Basic Feed back Control
House is too cold
Furnace
Thermostat Controller
recognized the house is too cold
sends signal to the furnace to turn on
and heat the house
furnace turns on
heats the housenatural
gas
house temperature
measured
is temperature
below setpoint?
Set-point = 200C
Controlled variable: temperature (desired output)
Input variable: temperature (measured by thermometer in thermostat)
Set-point: user-defined desired setting (temperature)
Manipulated variable: natural gas valve to furnace (subject to control)
277
 Output of the system y(t) is fed back to the set-pint
r(t) through measurement of a sensor
 Controller senses the difference between the set point
and the output and determines the error ε(t)
 Controller changes the manipulated variable u to
Process to eliminate the error.
Feedback Control is a Single Loop
278
Example #2 for Feedback Control
Examples:
 Room temperature control
 Automatic cruise control
 Steering an automobile
 Supply and demand of chemical engineers
Controller
Transmitter
Set point
stream
Temp
sensor
Heat loss
condensate
Feedback Control-block diagram
Terminology:
 Set point
 Manipulated variable (MV)
 Controlled variable (CV)
 Disturbance or load (DV)
 Process
 controller
Σ Controller process
Sensor +
transmitter
+
-Set point
Measured value
error
Manipulated
variable
Controlled variable
disturbance
281
THE ELEMENTS OF A FFEDBACK PROCESS CONTROL
SYSTEM
 LEVEL6:
282
A modern Feedback Control System
 Feedback control is not predictive: Controlled variable has to be
affected before controller takes action
 Requires management or operators to change set points to
optimize system:
- Changes can bring instability into system
- Optimization of many input and output variables
almost impossible
Limitations of Feedback Control
283
Apply the principles of feed-forward and show
how this type of control can be applied.
L.O #4
284
285
FEED-FORWARD CONTROL
 The feedback control can never achieve perfect control of a
chemical process
 Why?  Because the feedback control reacts only when it has
detected a deviation of the CONTROLLED VARIABLE from the
desired set point.
 However, the feed-forward control measures the disturbance
directly and takes control action to eliminate its impact on the
CONTROLLED VARIABLE
 Therefore  Feed-forward controllers have the theoretical
potential to achieve perfect control
Feedforward Control
Window is open
Furnace
Feedforward
Recognize window is open and
house will get cold in the future:
Someone reacts and changes controller
setpoint to turn on the furnace preemptively.
furnace turns on
heats the housenatural
gas
house temperature
is currently OK
turn on furnace
Decrease
setpoint to turn
furnace on
Pre-emptive move
to prevent house from
getting cold
286
 Feed-forward control avoids slowness of feedback control
 Disturbances are measured and accounted for before they
have time to affect the system
 In the house example, a feed-forward system measured the fact
that the window is opened
 As a result, automatically turn on the heater before the house can
get too cold
 Difficulty with feed-forward control: effects of
disturbances must be perfectly predicted
 There must not be any surprise effects of
disturbances
Feed-forward is a single loop
287
288
THE FEEDBACK AND FEED FORWARD
CONTROL
Both control involve a single loop with :
One measurement
 One manipulated variable.
However:
 In a feedback control, we measure the
controlled variable
 In a feed-forward control, we measure the
disturbance
L.O #5
Describe how the principles of cascade
control, ratio, the selective control and
split - range control are used in
processes control.
289
MULTI LOOPS PROCESS
CONTROL SYSTEM
290
291
CONTROL SYSTEMS WITH MULTIPLE LOOPS
 Other simples configurations which may use:
* More than one measurable variable and one
manipulated variable
* One measurable variable and more than one
manipulated variable
CASCADE CONTROL
In this configuration, we have :
 More than one measurement
 One manipulated variable
292
293
CASCADE CONTROL LOOPS
 Cascade control is two control loops using two different
measurements :
 1) One measurement for the controlled variable
 2) One measurement for the disturbance
 3) One manipulated variable
 The loop that measures the controlled variable is the
dominant or primary or master control loop
 The loop that measures the disturbance is the
secondary or slave loop
CASCADE FOR HEAT EXCHANGER
294
Cascade for jacketed CSTR
TRC
FC
Tc
T, Ca
W
Set Point
Wc
2A  B
Ratio Control is a special type of feed-
forward control
 Two disturbances are measured and
held in a constant ratio
 It is mostly used to control the ratio of
flow-rates of two streams
RATIO CONTROL :
296
EX: RATIO CONTROLLER IN A
BURNER
297
RATIO CONTROL LOOP
298
We measure both flow-rates and take
their ratio
 The ratio is compared to the desired ratio
 The error is sent to the ratio controller
Strategy of ratio control:
299
300
SELECTIVE CONTROL
 In this kind of control, we
 One manipulated variable
 Several controlled output
 Since with one manipulated variable, we can control only
one output, The selective control systems transfer control
action from one controlled output to another according
to need
 we will discuss
* Override Control
* Auctioneering control
301
SAFETY OF EQUIPMENTS: OVERRIDE
CONTROL
 During the normal operation of a plant or during its startup or shutdown ,
it is possible that a dangerous situation may arise and may lead to
destruction of equipment.
 In such cases, it is necessary to change from production control to safety
control in order to prevent a process variable from exceeding an
allowable upper or lower limit
 This can be achieved by the use of switches: The switch is used to select
between the production controller and the safety controller.
 The HSS ( high selector switch) is used whenever a variable should not exceed an
upper limit
 The LSS ( low selector switch) is used whenever a variable should not exceed a lower
limit.
EXAMPLE OF OVERRIDE
The steam header must be maintained above a minimum
pressure (PC FOR SAFETY). Steam from the header is
used to heat water in a heat exchanger.
The temperature of the hot water is controlled by TIC-101
(PRODUCTION CONTROLLER)
SAFETY FIRST: t is more important that the header
pressure be above its minimum than that the water
temperature be at its set-point.
302
303
304
SAFETY OF EQUIPMENTS:
AUCTIONEERING CONTROL
In this control system, among several
similar measurements, the one with the
highest value will feed the controller
 This is a selective control between
several measured variables.
EX: TUBULAR REACTOR
305
 The split range control has
 One measurement only ( Controlled variable)
 More than one manipulated variable ( control valve)
 If the valves are pneumatic: The instrumentation pressure range ( 3-15 psia) is
divided.
 If the valves are electrical: The instrumentation current ( 4-20 mA) is divided.
 Ex: If we have two pneumatic valves:
 Valve #1 will operate between 3- 9 psia and Valve #2 will operate between 9 -
15 psia.
SPLIT RANGE CONTROL
306
Split Range Flow Control
 In certain applications, a single flow control loop cannot
provide accurate flow metering over the full range of
operation.
 Split range flow control uses two flow controllers (one
with a small control valve and one with a large control
valve) in parallel.
 At low flow rates, the large valve is closed and the
small valve provides accurate flow control.
 At large flow rates, both valve are open.
307
EX: Split Range Temperature
Control
TT
Cooling
Water
Steam
Split-Range
Temperature
Controller
TT TC
RSP
308
L.O #6: DIGITAL
CONTROL SYSTEM
THE CONTROLLER IS A SOFTWARE
IN COMPUTER
309
DIGITAL CONTROLLER
 Digital control is a branch of control theory that uses
digital computers to act as system controllers.
 Depending on the requirements, a digital control system
can take the form of a microcontroller to an ASIC to a
standard desktop computer.
 Since a digital computer is a discrete system, the Laplace
310
PLC:
Programmable Logic Controller
CPU
System
User Ladder
Diagram
Working
memory
registers
Input
Flag
Output
Input
Module
Output
Module
311
DIGITAL CONTROLLER
Typically, a digital controller requires:
 A/D conversion to convert analog inputs to
machine readable (digital) format
 D/A conversion to convert digital outputs
to a form that can be input to a plant
(analog)
 A program that relates the outputs to the
inputs
312
313
Block diagram of a digital control
system
control:
difference
equations
D/A and
hold
sensor
1
r(t) u(kT) u(t)e(kT)
+
-
r(kT) plant
G(s)
y(t)
clock
A/D
T
T
y(kT)
digital controller
voltage → bit
bit → voltage
An Large Size PLC
 The main module measures
19” x 20” x 14.5”.
 have upto 10,000 I/O points
 supports all functions
 expansion slots to
accommodate PC and other
communication devices.
Allen-Bradley PLC-3
314
A Small Size PLC
 Measures 4.72”x 3.15” x
1.57”.
 32 I/O points
 Standard RS 232 serial
communication port
Allen-Bradley MicroLogix 1000
315
PLC ARCHITECTURE
Programmable controllers replace most of the
relay panel wiring by software programming.
Processor
I/O
Modules
Memory
Power
Supply
Program
Loader
Printer
Cassette
Loader
EPROM
Loader
Switches
Machines
Peripherals External Devices
PC
A typical PLC316
PLC COMPONENTS
1. Processor Microprocessor based, may allow arithmetic
operations, logic operators, block memory moves,
computer interface, local area network, functions, etc.
2. Memory Measured in words.
ROM (Read Only Memory),
RAM (Random Access Memory),
PROM (Programmable Read Only Memory),
EEPROM (Electric Erasable Programmable ROM),
EPROM (Erasable Programmable Read Only Memory),
EAPROM (Electronically Alterable Programmable
Read Only Memory), and
Bubble Memory.
317
PLC COMPONENTS3. I/O Modular plug-in periphery
AC voltage input and output,
DC voltage input and output,
Low level analog input,
High level analog input and output,
Special purpose modules, e.g., high speed timers,
Stepping motor controllers, etc. PID, Motion
4. Power supply AC power
5. Peripheral hand-held programmer (HHP)
CRT programmer
operator console
printer
simulator
EPROM loader
graphics processor
network communication interface
modular PC
318
Distributed Control Systems
319
Distributed Control Systems
 Collection of hardware and instrumentation necessary
for implementing control systems
 Provide the infrastructure (platform) for implementing
advanced control algorithms
History of Control Hardware
 Pneumatic Implementation:
 Transmission: the signals transmitted pneumatically are slow
responding and susceptible to interference.
 Calculation: Mechanical computation devices must be relatively
simple and tend to wear out quickly.
History (cont.)
 Electron analog implementation:
 Transmission: analog signals are susceptible to noise,
and signal quality degrades over long transmission
line.
 Calculation: the type of computations possible with
electronic analog devices is still limited.
History (cont.)
 Digital Implementation:
 Transmission: Digital signals are far less sensitive to
noise.
 Calculation: The computational devices are digital
computers.
Advantages of Digital System
 Digital computers are more flexible because they are
programmable and no limitation to the complexity of
the computations it can carry out.
 Digital systems are more precise.
 Digital system cost less to install and maintain
 Digital data in electronic files can be printed out,
displayed on color terminals, stored in highly
compressed form.
Computer Control Networks
1. PC Control:
 Good for small
processes such as
laboratory prototype
or pilot plants, where
the number of control
loops is relatively
small
PROCESS
Final
control
element
Data
acquisition
Main
Computer
Display
Computer Control Networks
2. Programmable Logic Controllers:
 specialized for non-continuous systems such as batch
processes.
 It can be used when interlocks are required; e.g., a
flow control loop cannot be actuated unless a pump
has been turned on.
 During startup or shutdown of continuous processes.
DCS: Computer Control Networks
Operator
Control
Panel
Main
Control
Computer
Operator
Control
Panel
Archival
Data
Storage
Supervisory (host)
Computer
PROCESS
Local
Computer
Local
Computer
Local
Computer
Local Display Local Display
Data highway
To other Processes To other Processes
Local data acquisition and
control computers
3. DCS
•Most
comprehensive
DCS Elements-1
 Local Control Unit: This unit can handle 8 to 16 individual
PID loops.
 Data Acquisition Unit: Digital (discrete) and analog I/O can
be handle.
 Batch Sequencing Unit: This unit controls a timing
counters, arbitrary function generators, and internal logic.
 Local Display: This device provides analog display stations,
and video display for readout.
 Bulk Memory Unit: This unit is used to store and recall
process data.
DCS Elements-2
 General Purpose Computer : This unit is programmed by a
customer or third party to perform optimization, advance
control, expert system, etc
 Central Operator Display: This unit typically contain several
consoles for operator communication with the system, and
multiple video color graphics display units
 Data Highway : A serial digital data transmission link
connecting all other components in the system. It allow for
redundant data highway to reduce the risk of data loss
 Local area Network (LAN)
Advantages of DCS
 Access a large amount of current information from the data
highway.
 Monitoring trends of past process conditions.
 Readily install new on-line measurements together with local
computers.
 Alternate quickly among standard control strategies and
readjust controller parameters in software.
 A sight full engineer can use the flexibility of the framework to
implement his latest controller design ideas on the host
computer.
Modes of Computer control
signals from digital
computer
Local PID
controller
Supervisory Control mode
Direct digital Control mode
valve setting
from computer
Flow measurement
to computer
1.Manual
2.Automatic
• PID with local set point
3.Supervisory
• PID with remote set
point (supervisory)
4.Advanced
Additional Advantage
Digital DCS systems are more
flexible. Control algorithms can
be changed and control
configuration can be modified
without having rewiring the
system.
Categories of process information
ExampleType
Relay, Switch
Solenoid valve
Motor drive
1. Digital
Alphanumerical displays2. Generalized digital
Turbine flow meter
Stepping motor
3. Pulse
Thermocouple or strain gauge (mill volt)
Process instrumentation (4-20 am)
Other sensors (0-5 Volt)
4. Analog
A/D and D/A converters or transducers are the
Interface between digital computer and analog
instruments
(A/D) Transducers convert analog
signals to digital signals.
(Sensor Computer)
(D/A) Transducers convert digital
signals to analog signals.
(Computer Valve)
Data resolution due to digitization
 Accuracy depends on resolution.
 Resolution depends on number of bits:
Resolution = signal range × 1/(2m -1)
m = number of bits used by the digitizer (A/D) to
represent the analog data
Data Resolution
 Signal = 0 - 1 Volt, 3 bit digitizer:
Analog range
covered
Analog
equivalent
Digital
Equivalent
Binary
representation
0 to 1/14
1/14 to 3/14
3/14 to 5/14
5/14 to 7/14
7/14 to 9/14
9/14 to 11/14
11/14 to 13/14
13/14 to
14/14
0
1/7
2/7
3/7
4/7
5/7
6/7
1
0
1
2
3
4
5
6
7
0 0 0
0 0 1
0 1 0
0 1 1
1 0 0
1 0 1
1 1 0
1 1 1
Data Resolution
0 1/7 2/7 3/7 4/7 5/7 6/7 1
0
1
2
3
4
5
6
7
Analog data
Digitaldata
Utilization of DCS
 DCS vendor job:
 installation
 Control Engineer Job:
 Configuration
 Built-in PID control:
 How to Tune the PID control?
Utilization of DCS
 Implementation of advanced control:
 Developed software for control algorithms, DMC,
Aspen, etc.
 Control-oriented programming language supplied by the
DCS vendors.
 Self-developed programs using high-level programming
languages (Fortran, C++)
Advanced control topology
DCS Vendors
 Honeywell
 Fisher-Rosemont
 Baily
 Foxboro
 Yokogawa
 Siemen
PI&D AND PFD
342
 Process flow diagrams (PFDs) are used in chemical and
process engineering. These diagrams show the flow of
chemicals and the equipment involved in the process.
 Generally, a Process Flow Diagram shows only the
major equipment and doesn't show details. PFDs are
used for visitor information and new employee
training.
DEFINITION OF PFD
343
 A Process and Instrument Drawing (P&ID) includes more details
than a PFD. It includes major and minor flows, control loops and
instrumentation.
 P&ID is sometimes referred to as a Piping and Instrumentation
Drawing. These diagrams are also called flow-sheets.
 P&IDs are used by process technicians and instrument and
electrical, mechanical, safety, and engineering personnel.
DEFINITION OF PI&D
344
PFD & PI&D
In both diagrams arrows show the flow of
material and symbols show tanks, valves,
and other equipment. The symbols used
vary somewhat from organization to
organization. So you may see several
different symbols that all represent a
motor. 345
EXAMPLE OF PFD
346
EQUIVALENT PI&D
347
P& ID SYMBOLS
ISA Symbols and Loop Diagrams
348
 Piping and Instrumentation Diagrams or simply P&IDs are
the “schematics” used in the field of instrumentation and
control (Automation)
 The P&ID is used to by field techs, engineers, and
operators to better understand the process and how the
instrumentation is inter connected.
INTRODUCTION
349
 Most industries have standardized the symbols according to the
ISA Standard S5.1 Instrumentation Symbol Specification.
Piping & Instrumentation Drawing (original)
Process & Instrumentation Diagram (also used)
Process Flow Diagram – PFD (simplified version of the P&ID)
ISA Standard S5.1 Instrumentation
Symbol Specification
350
Building the P&ID using examples like
pressure or temperature control.
L.O #1
351
352
353
From the typical example, define Tag
Numbers and Tag Descriptors.
L.O #2
354
355
356
Learn the ISA S5.1 Identification Letters like
(TI, PC, LR, TRC, …)
L.O #3
357
358
Class work: identify the following
359
Determine the instrumentation
location
L.O #4
360
361
Learn about Shared Displays/Shared Control and
draw a summary of instrument type & location
L.O #5
362
363
364
PIPING & CONNECTIONS
SYMBOLS
L.O #6 : Identify Piping, Connection
and valves Symbols
365
366
VALVE SYMBOLS
367
368
Different industrial examples will be
studied.
L.O #7
369
370
CLASS WORK
371
SOLUTION
372
PFD: PROCESS FLOW DIAGRAM
373
374
PFD Drawing Symbols
375
Other Symbols for PFD
Table 1.2 : Conventions Used for Identifying Process Equipment
Process Equipment General Format XX-YZZ A/B
XX are the identification letters for the equipment classification
C - Compressor or Turbine
E - Heat Exchanger
H - Fired Heater
P - Pump
R - Reactor
T - Tower
TK - Storage Tank
V - Vessel
Y designates an area within the plant
ZZ are the number designation for each item in an equipment class
A/B identifies parallel units or backup units not shown on a PFD
Supplemental
Information
Additional description of equipment given on top of PFD
376
Equipment Numbering
 XX-YZZ A/B/…
 XX represents a 1- or 2-letter
designation for the equipment (P =
pump)
 Y is the 1 or 2 digit unit number (1-99)
 ZZ designates the equipment number
for the unit (1-99)
 A/B/… represents the presence of
spare equipment377
Examples
T-905 is the 5th tower in unit
nine hundred
P-301 A/B is the 1st Pump in unit
three hundred plus a spare
378
Equipment Information
 Equipment are identified by number and a
label (name) positioned above the
equipment on the PFD
 Basic data such as size and key data are
included in a separate table (Equipment
Summary Table).
379
Streams identification
380
Process and Utility Streams
381
Number of streams and information
Stream Number 1 2 3 4 5 6 7 8 9 10
Temperature (°C) 25 59 25 225 41 600 41 38 654 90
Pressure (bar) 1.90 25.8 25.5 25.2 25.5 25.0 25.5 23.9 24.0 2.6
Vapor Fraction 0.0 0.0 1.00 1.0 1.0 1.0 1.0 1.0 1.0 0.0
Mass Flow (tonne/h) 10.0 13.3 0.82 20.5 6.41 20.5 0.36 9.2 20.9 11.6
Mole Flow (kmol/h) 108.7 144.2 301.0 1204.4 758.8 1204.4 42.6 1100.8 1247.0 142.2
Component Mole Flow
(kmol/h)
Hydrogen 0.0 0.0 286.0 735.4 449.4 735.4 25.2 651.9 652.6 0.02
Methane 0.0 0.0 15.0 317.3 302.2 317.3 16.95 438.3 442.3 0.88
Benzene 0.0 1.0 0.0 7.6 6.6 7.6 0.37 9.55 116.0 106.3
Toluene 108.7 143.2 0.0 144.0 0.7 144.0 0.04 1.05 36.0 35.0
A Portion of Table 1.5
382
Class work: identify all the
information
383
CASE STUDY FOR THE COURSE
384
Process Instrumentation & Control

Más contenido relacionado

La actualidad más candente

PRESSURE INSTRUMENTATION
PRESSURE INSTRUMENTATIONPRESSURE INSTRUMENTATION
PRESSURE INSTRUMENTATIONsanket kulkarni
 
Introduction of process control
Introduction of process controlIntroduction of process control
Introduction of process controlKarnav Rana
 
Piping and instrumentation diagram (p&amp;id)
Piping and instrumentation diagram (p&amp;id)Piping and instrumentation diagram (p&amp;id)
Piping and instrumentation diagram (p&amp;id)Karnav Rana
 
Level measuring instruments
Level measuring instrumentsLevel measuring instruments
Level measuring instrumentsAttiya Rehman
 
Basic instrumentation
Basic instrumentationBasic instrumentation
Basic instrumentationss61
 
Basics of Instrumentation & Control.pptx
Basics of Instrumentation & Control.pptxBasics of Instrumentation & Control.pptx
Basics of Instrumentation & Control.pptxshridharkulkarni58
 
Basic concepts of instrumentation
Basic concepts of instrumentationBasic concepts of instrumentation
Basic concepts of instrumentationG. Udhaya Sankar
 
Field transmitters
Field transmittersField transmitters
Field transmittersPrasad Godse
 
Pressure measurement id Mitesh Kuamr
Pressure measurement id Mitesh KuamrPressure measurement id Mitesh Kuamr
Pressure measurement id Mitesh KuamrMitesh Kumar
 
Transducers & transmitters
Transducers & transmittersTransducers & transmitters
Transducers & transmittersMNButt
 
Pressure Measurements | Comprehensive search
Pressure Measurements | Comprehensive searchPressure Measurements | Comprehensive search
Pressure Measurements | Comprehensive searchMohanad Alani
 

La actualidad más candente (20)

A Presentation on Field Instrumentation.
A Presentation on Field Instrumentation.A Presentation on Field Instrumentation.
A Presentation on Field Instrumentation.
 
PRESSURE INSTRUMENTATION
PRESSURE INSTRUMENTATIONPRESSURE INSTRUMENTATION
PRESSURE INSTRUMENTATION
 
Basic instrumentation
Basic instrumentationBasic instrumentation
Basic instrumentation
 
Control system
Control systemControl system
Control system
 
Introduction of process control
Introduction of process controlIntroduction of process control
Introduction of process control
 
Instrumentation
InstrumentationInstrumentation
Instrumentation
 
Piping and instrumentation diagram (p&amp;id)
Piping and instrumentation diagram (p&amp;id)Piping and instrumentation diagram (p&amp;id)
Piping and instrumentation diagram (p&amp;id)
 
Instrumentation
InstrumentationInstrumentation
Instrumentation
 
Level measuring instruments
Level measuring instrumentsLevel measuring instruments
Level measuring instruments
 
Basic instrumentation
Basic instrumentationBasic instrumentation
Basic instrumentation
 
Basics of Instrumentation & Control.pptx
Basics of Instrumentation & Control.pptxBasics of Instrumentation & Control.pptx
Basics of Instrumentation & Control.pptx
 
Pressure Switch
Pressure Switch Pressure Switch
Pressure Switch
 
Basic concepts of instrumentation
Basic concepts of instrumentationBasic concepts of instrumentation
Basic concepts of instrumentation
 
Field transmitters
Field transmittersField transmitters
Field transmitters
 
Pressure measurement id Mitesh Kuamr
Pressure measurement id Mitesh KuamrPressure measurement id Mitesh Kuamr
Pressure measurement id Mitesh Kuamr
 
Class 4 process control loops
Class 4   process control loopsClass 4   process control loops
Class 4 process control loops
 
About Pressure Gauge & Pressure Transmitter ppt
About Pressure Gauge & Pressure Transmitter pptAbout Pressure Gauge & Pressure Transmitter ppt
About Pressure Gauge & Pressure Transmitter ppt
 
Transducers & transmitters
Transducers & transmittersTransducers & transmitters
Transducers & transmitters
 
Pressure Measurements | Comprehensive search
Pressure Measurements | Comprehensive searchPressure Measurements | Comprehensive search
Pressure Measurements | Comprehensive search
 
Instrumentation
Instrumentation Instrumentation
Instrumentation
 

Similar a Process Instrumentation & Control

Brief information of Electricity and wiring
Brief information of Electricity and wiring Brief information of Electricity and wiring
Brief information of Electricity and wiring Mani Das
 
ppt on Introduction to basic electrical concept by harshid panchal
ppt on Introduction to basic electrical concept by harshid panchalppt on Introduction to basic electrical concept by harshid panchal
ppt on Introduction to basic electrical concept by harshid panchalharshid panchal
 
Current Electricity Chp-8 General Science 9th 10th
Current Electricity  Chp-8 General Science 9th 10thCurrent Electricity  Chp-8 General Science 9th 10th
Current Electricity Chp-8 General Science 9th 10thKamran Abdullah
 
Chapter1: Electricity
Chapter1: ElectricityChapter1: Electricity
Chapter1: Electricitymarjerin
 
Basic Principles of Electricity
Basic Principles of ElectricityBasic Principles of Electricity
Basic Principles of ElectricityJeric Cantillana
 
Current and Electricity for class 10.pdf
Current and Electricity for class 10.pdfCurrent and Electricity for class 10.pdf
Current and Electricity for class 10.pdfJackHassan2
 
Current and Electricity for class 10.pdf
Current and Electricity for class 10.pdfCurrent and Electricity for class 10.pdf
Current and Electricity for class 10.pdfJackHassan2
 
Chapter 11 physics
Chapter 11 physicsChapter 11 physics
Chapter 11 physicsKrishna Gali
 
Sci 1010 chapter 8
Sci 1010 chapter 8Sci 1010 chapter 8
Sci 1010 chapter 8stanbridge
 

Similar a Process Instrumentation & Control (20)

Brief information of Electricity and wiring
Brief information of Electricity and wiring Brief information of Electricity and wiring
Brief information of Electricity and wiring
 
Fundamental electronic.pptx
Fundamental electronic.pptxFundamental electronic.pptx
Fundamental electronic.pptx
 
ppt on Introduction to basic electrical concept by harshid panchal
ppt on Introduction to basic electrical concept by harshid panchalppt on Introduction to basic electrical concept by harshid panchal
ppt on Introduction to basic electrical concept by harshid panchal
 
Basics Of Electricity
Basics Of ElectricityBasics Of Electricity
Basics Of Electricity
 
EMAG FINALS HW.
EMAG FINALS HW.EMAG FINALS HW.
EMAG FINALS HW.
 
COMPLETE FINAL EMAG PPT.
COMPLETE FINAL EMAG PPT.COMPLETE FINAL EMAG PPT.
COMPLETE FINAL EMAG PPT.
 
Current Electricity Chp-8 General Science 9th 10th
Current Electricity  Chp-8 General Science 9th 10thCurrent Electricity  Chp-8 General Science 9th 10th
Current Electricity Chp-8 General Science 9th 10th
 
Chapter1: Electricity
Chapter1: ElectricityChapter1: Electricity
Chapter1: Electricity
 
Lesson2 (electro mag)
Lesson2 (electro mag)Lesson2 (electro mag)
Lesson2 (electro mag)
 
new lec electromag.
new lec electromag.new lec electromag.
new lec electromag.
 
Electricity
ElectricityElectricity
Electricity
 
Mesh and nodal
Mesh and nodalMesh and nodal
Mesh and nodal
 
Basic Principles of Electricity
Basic Principles of ElectricityBasic Principles of Electricity
Basic Principles of Electricity
 
Current and Electricity for class 10.pdf
Current and Electricity for class 10.pdfCurrent and Electricity for class 10.pdf
Current and Electricity for class 10.pdf
 
Current and Electricity for class 10.pdf
Current and Electricity for class 10.pdfCurrent and Electricity for class 10.pdf
Current and Electricity for class 10.pdf
 
120A WOBC ELO1
120A WOBC ELO1120A WOBC ELO1
120A WOBC ELO1
 
Chapter 1.ppt
Chapter 1.pptChapter 1.ppt
Chapter 1.ppt
 
Chapter 1.ppt
Chapter 1.pptChapter 1.ppt
Chapter 1.ppt
 
Chapter 11 physics
Chapter 11 physicsChapter 11 physics
Chapter 11 physics
 
Sci 1010 chapter 8
Sci 1010 chapter 8Sci 1010 chapter 8
Sci 1010 chapter 8
 

Más de Zin Eddine Dadach

Environmental impact of power plants
Environmental impact of power plants Environmental impact of power plants
Environmental impact of power plants Zin Eddine Dadach
 
إدارة موارد القوى العاملة في المؤسسات الإسلامية
إدارة موارد القوى العاملة في المؤسسات الإسلاميةإدارة موارد القوى العاملة في المؤسسات الإسلامية
إدارة موارد القوى العاملة في المؤسسات الإسلاميةZin Eddine Dadach
 
قوانين العلم الإلهي للصدقات: الحل الإسلامي للنزعة الاستهلاكية وعواقبها
قوانين العلم الإلهي للصدقات: الحل الإسلامي للنزعة الاستهلاكية وعواقبهاقوانين العلم الإلهي للصدقات: الحل الإسلامي للنزعة الاستهلاكية وعواقبها
قوانين العلم الإلهي للصدقات: الحل الإسلامي للنزعة الاستهلاكية وعواقبهاZin Eddine Dadach
 
الصّدقات: قوانين العلم الإلهي
الصّدقات: قوانين العلم الإلهيالصّدقات: قوانين العلم الإلهي
الصّدقات: قوانين العلم الإلهيZin Eddine Dadach
 
الصّدقات: قوانين العلم الإلهي
الصّدقات: قوانين العلم الإلهيالصّدقات: قوانين العلم الإلهي
الصّدقات: قوانين العلم الإلهيZin Eddine Dadach
 
نجاح أساليب التدريس التي اتبعها النبي محمد (صلى الله عليه وسلم) في التعليم ال...
نجاح أساليب التدريس التي اتبعها النبي محمد (صلى الله عليه وسلم) في التعليم ال...نجاح أساليب التدريس التي اتبعها النبي محمد (صلى الله عليه وسلم) في التعليم ال...
نجاح أساليب التدريس التي اتبعها النبي محمد (صلى الله عليه وسلم) في التعليم ال...Zin Eddine Dadach
 
SIMULATION, EXERGY EFFICIENCY AND ENVIRONMENTAL IMPACT OF ELECTRICITY OF A 62...
SIMULATION, EXERGY EFFICIENCY AND ENVIRONMENTAL IMPACT OF ELECTRICITY OF A 62...SIMULATION, EXERGY EFFICIENCY AND ENVIRONMENTAL IMPACT OF ELECTRICITY OF A 62...
SIMULATION, EXERGY EFFICIENCY AND ENVIRONMENTAL IMPACT OF ELECTRICITY OF A 62...Zin Eddine Dadach
 
الطّريق الأبديّ للصّدقات
الطّريق الأبديّ للصّدقاتالطّريق الأبديّ للصّدقات
الطّريق الأبديّ للصّدقاتZin Eddine Dadach
 
Welcome to Process Operations for Diploma students
Welcome to Process Operations for Diploma studentsWelcome to Process Operations for Diploma students
Welcome to Process Operations for Diploma studentsZin Eddine Dadach
 
INTRODUCTORY CHEMICAL ENGINEERING COURSE BASED ON ANALOGIES AND
INTRODUCTORY CHEMICAL ENGINEERING COURSE BASED ON ANALOGIES  AND INTRODUCTORY CHEMICAL ENGINEERING COURSE BASED ON ANALOGIES  AND
INTRODUCTORY CHEMICAL ENGINEERING COURSE BASED ON ANALOGIES AND Zin Eddine Dadach
 
Fluid mechanics for chermical engineering students
Fluid mechanics  for chermical  engineering studentsFluid mechanics  for chermical  engineering students
Fluid mechanics for chermical engineering studentsZin Eddine Dadach
 

Más de Zin Eddine Dadach (20)

PROJECT MANAGEMENT
PROJECT MANAGEMENT PROJECT MANAGEMENT
PROJECT MANAGEMENT
 
EXERGOECONOMIC ANALYSIS
EXERGOECONOMIC ANALYSISEXERGOECONOMIC ANALYSIS
EXERGOECONOMIC ANALYSIS
 
EOR strategy
EOR strategy EOR strategy
EOR strategy
 
Environmental impact of power plants
Environmental impact of power plants Environmental impact of power plants
Environmental impact of power plants
 
إدارة موارد القوى العاملة في المؤسسات الإسلامية
إدارة موارد القوى العاملة في المؤسسات الإسلاميةإدارة موارد القوى العاملة في المؤسسات الإسلامية
إدارة موارد القوى العاملة في المؤسسات الإسلامية
 
روح الإسلام
روح الإسلامروح الإسلام
روح الإسلام
 
قوانين العلم الإلهي للصدقات: الحل الإسلامي للنزعة الاستهلاكية وعواقبها
قوانين العلم الإلهي للصدقات: الحل الإسلامي للنزعة الاستهلاكية وعواقبهاقوانين العلم الإلهي للصدقات: الحل الإسلامي للنزعة الاستهلاكية وعواقبها
قوانين العلم الإلهي للصدقات: الحل الإسلامي للنزعة الاستهلاكية وعواقبها
 
الصّدقات: قوانين العلم الإلهي
الصّدقات: قوانين العلم الإلهيالصّدقات: قوانين العلم الإلهي
الصّدقات: قوانين العلم الإلهي
 
الصّدقات: قوانين العلم الإلهي
الصّدقات: قوانين العلم الإلهيالصّدقات: قوانين العلم الإلهي
الصّدقات: قوانين العلم الإلهي
 
نجاح أساليب التدريس التي اتبعها النبي محمد (صلى الله عليه وسلم) في التعليم ال...
نجاح أساليب التدريس التي اتبعها النبي محمد (صلى الله عليه وسلم) في التعليم ال...نجاح أساليب التدريس التي اتبعها النبي محمد (صلى الله عليه وسلم) في التعليم ال...
نجاح أساليب التدريس التي اتبعها النبي محمد (صلى الله عليه وسلم) في التعليم ال...
 
SIMULATION, EXERGY EFFICIENCY AND ENVIRONMENTAL IMPACT OF ELECTRICITY OF A 62...
SIMULATION, EXERGY EFFICIENCY AND ENVIRONMENTAL IMPACT OF ELECTRICITY OF A 62...SIMULATION, EXERGY EFFICIENCY AND ENVIRONMENTAL IMPACT OF ELECTRICITY OF A 62...
SIMULATION, EXERGY EFFICIENCY AND ENVIRONMENTAL IMPACT OF ELECTRICITY OF A 62...
 
الطّريق الأبديّ للصّدقات
الطّريق الأبديّ للصّدقاتالطّريق الأبديّ للصّدقات
الطّريق الأبديّ للصّدقات
 
Eternal path of charity
Eternal path of charity Eternal path of charity
Eternal path of charity
 
Welcome to Process Operations for Diploma students
Welcome to Process Operations for Diploma studentsWelcome to Process Operations for Diploma students
Welcome to Process Operations for Diploma students
 
INTRODUCTORY CHEMICAL ENGINEERING COURSE BASED ON ANALOGIES AND
INTRODUCTORY CHEMICAL ENGINEERING COURSE BASED ON ANALOGIES  AND INTRODUCTORY CHEMICAL ENGINEERING COURSE BASED ON ANALOGIES  AND
INTRODUCTORY CHEMICAL ENGINEERING COURSE BASED ON ANALOGIES AND
 
Fluid mechanics for chermical engineering students
Fluid mechanics  for chermical  engineering studentsFluid mechanics  for chermical  engineering students
Fluid mechanics for chermical engineering students
 
Transport phenomena
Transport phenomenaTransport phenomena
Transport phenomena
 
Gas engineering
Gas engineeringGas engineering
Gas engineering
 
BUSINESS RESEARCH METHODS
BUSINESS RESEARCH METHODSBUSINESS RESEARCH METHODS
BUSINESS RESEARCH METHODS
 
Hysys simulation
Hysys simulationHysys simulation
Hysys simulation
 

Último

Introduction to ArtificiaI Intelligence in Higher Education
Introduction to ArtificiaI Intelligence in Higher EducationIntroduction to ArtificiaI Intelligence in Higher Education
Introduction to ArtificiaI Intelligence in Higher Educationpboyjonauth
 
Sanyam Choudhary Chemistry practical.pdf
Sanyam Choudhary Chemistry practical.pdfSanyam Choudhary Chemistry practical.pdf
Sanyam Choudhary Chemistry practical.pdfsanyamsingh5019
 
CARE OF CHILD IN INCUBATOR..........pptx
CARE OF CHILD IN INCUBATOR..........pptxCARE OF CHILD IN INCUBATOR..........pptx
CARE OF CHILD IN INCUBATOR..........pptxGaneshChakor2
 
BASLIQ CURRENT LOOKBOOK LOOKBOOK(1) (1).pdf
BASLIQ CURRENT LOOKBOOK  LOOKBOOK(1) (1).pdfBASLIQ CURRENT LOOKBOOK  LOOKBOOK(1) (1).pdf
BASLIQ CURRENT LOOKBOOK LOOKBOOK(1) (1).pdfSoniaTolstoy
 
Student login on Anyboli platform.helpin
Student login on Anyboli platform.helpinStudent login on Anyboli platform.helpin
Student login on Anyboli platform.helpinRaunakKeshri1
 
Contemporary philippine arts from the regions_PPT_Module_12 [Autosaved] (1).pptx
Contemporary philippine arts from the regions_PPT_Module_12 [Autosaved] (1).pptxContemporary philippine arts from the regions_PPT_Module_12 [Autosaved] (1).pptx
Contemporary philippine arts from the regions_PPT_Module_12 [Autosaved] (1).pptxRoyAbrique
 
Industrial Policy - 1948, 1956, 1973, 1977, 1980, 1991
Industrial Policy - 1948, 1956, 1973, 1977, 1980, 1991Industrial Policy - 1948, 1956, 1973, 1977, 1980, 1991
Industrial Policy - 1948, 1956, 1973, 1977, 1980, 1991RKavithamani
 
Mastering the Unannounced Regulatory Inspection
Mastering the Unannounced Regulatory InspectionMastering the Unannounced Regulatory Inspection
Mastering the Unannounced Regulatory InspectionSafetyChain Software
 
Privatization and Disinvestment - Meaning, Objectives, Advantages and Disadva...
Privatization and Disinvestment - Meaning, Objectives, Advantages and Disadva...Privatization and Disinvestment - Meaning, Objectives, Advantages and Disadva...
Privatization and Disinvestment - Meaning, Objectives, Advantages and Disadva...RKavithamani
 
Arihant handbook biology for class 11 .pdf
Arihant handbook biology for class 11 .pdfArihant handbook biology for class 11 .pdf
Arihant handbook biology for class 11 .pdfchloefrazer622
 
Beyond the EU: DORA and NIS 2 Directive's Global Impact
Beyond the EU: DORA and NIS 2 Directive's Global ImpactBeyond the EU: DORA and NIS 2 Directive's Global Impact
Beyond the EU: DORA and NIS 2 Directive's Global ImpactPECB
 
A Critique of the Proposed National Education Policy Reform
A Critique of the Proposed National Education Policy ReformA Critique of the Proposed National Education Policy Reform
A Critique of the Proposed National Education Policy ReformChameera Dedduwage
 
Paris 2024 Olympic Geographies - an activity
Paris 2024 Olympic Geographies - an activityParis 2024 Olympic Geographies - an activity
Paris 2024 Olympic Geographies - an activityGeoBlogs
 
Software Engineering Methodologies (overview)
Software Engineering Methodologies (overview)Software Engineering Methodologies (overview)
Software Engineering Methodologies (overview)eniolaolutunde
 
Activity 01 - Artificial Culture (1).pdf
Activity 01 - Artificial Culture (1).pdfActivity 01 - Artificial Culture (1).pdf
Activity 01 - Artificial Culture (1).pdfciinovamais
 
Grant Readiness 101 TechSoup and Remy Consulting
Grant Readiness 101 TechSoup and Remy ConsultingGrant Readiness 101 TechSoup and Remy Consulting
Grant Readiness 101 TechSoup and Remy ConsultingTechSoup
 
SOCIAL AND HISTORICAL CONTEXT - LFTVD.pptx
SOCIAL AND HISTORICAL CONTEXT - LFTVD.pptxSOCIAL AND HISTORICAL CONTEXT - LFTVD.pptx
SOCIAL AND HISTORICAL CONTEXT - LFTVD.pptxiammrhaywood
 
Web & Social Media Analytics Previous Year Question Paper.pdf
Web & Social Media Analytics Previous Year Question Paper.pdfWeb & Social Media Analytics Previous Year Question Paper.pdf
Web & Social Media Analytics Previous Year Question Paper.pdfJayanti Pande
 
1029-Danh muc Sach Giao Khoa khoi 6.pdf
1029-Danh muc Sach Giao Khoa khoi  6.pdf1029-Danh muc Sach Giao Khoa khoi  6.pdf
1029-Danh muc Sach Giao Khoa khoi 6.pdfQucHHunhnh
 
Q4-W6-Restating Informational Text Grade 3
Q4-W6-Restating Informational Text Grade 3Q4-W6-Restating Informational Text Grade 3
Q4-W6-Restating Informational Text Grade 3JemimahLaneBuaron
 

Último (20)

Introduction to ArtificiaI Intelligence in Higher Education
Introduction to ArtificiaI Intelligence in Higher EducationIntroduction to ArtificiaI Intelligence in Higher Education
Introduction to ArtificiaI Intelligence in Higher Education
 
Sanyam Choudhary Chemistry practical.pdf
Sanyam Choudhary Chemistry practical.pdfSanyam Choudhary Chemistry practical.pdf
Sanyam Choudhary Chemistry practical.pdf
 
CARE OF CHILD IN INCUBATOR..........pptx
CARE OF CHILD IN INCUBATOR..........pptxCARE OF CHILD IN INCUBATOR..........pptx
CARE OF CHILD IN INCUBATOR..........pptx
 
BASLIQ CURRENT LOOKBOOK LOOKBOOK(1) (1).pdf
BASLIQ CURRENT LOOKBOOK  LOOKBOOK(1) (1).pdfBASLIQ CURRENT LOOKBOOK  LOOKBOOK(1) (1).pdf
BASLIQ CURRENT LOOKBOOK LOOKBOOK(1) (1).pdf
 
Student login on Anyboli platform.helpin
Student login on Anyboli platform.helpinStudent login on Anyboli platform.helpin
Student login on Anyboli platform.helpin
 
Contemporary philippine arts from the regions_PPT_Module_12 [Autosaved] (1).pptx
Contemporary philippine arts from the regions_PPT_Module_12 [Autosaved] (1).pptxContemporary philippine arts from the regions_PPT_Module_12 [Autosaved] (1).pptx
Contemporary philippine arts from the regions_PPT_Module_12 [Autosaved] (1).pptx
 
Industrial Policy - 1948, 1956, 1973, 1977, 1980, 1991
Industrial Policy - 1948, 1956, 1973, 1977, 1980, 1991Industrial Policy - 1948, 1956, 1973, 1977, 1980, 1991
Industrial Policy - 1948, 1956, 1973, 1977, 1980, 1991
 
Mastering the Unannounced Regulatory Inspection
Mastering the Unannounced Regulatory InspectionMastering the Unannounced Regulatory Inspection
Mastering the Unannounced Regulatory Inspection
 
Privatization and Disinvestment - Meaning, Objectives, Advantages and Disadva...
Privatization and Disinvestment - Meaning, Objectives, Advantages and Disadva...Privatization and Disinvestment - Meaning, Objectives, Advantages and Disadva...
Privatization and Disinvestment - Meaning, Objectives, Advantages and Disadva...
 
Arihant handbook biology for class 11 .pdf
Arihant handbook biology for class 11 .pdfArihant handbook biology for class 11 .pdf
Arihant handbook biology for class 11 .pdf
 
Beyond the EU: DORA and NIS 2 Directive's Global Impact
Beyond the EU: DORA and NIS 2 Directive's Global ImpactBeyond the EU: DORA and NIS 2 Directive's Global Impact
Beyond the EU: DORA and NIS 2 Directive's Global Impact
 
A Critique of the Proposed National Education Policy Reform
A Critique of the Proposed National Education Policy ReformA Critique of the Proposed National Education Policy Reform
A Critique of the Proposed National Education Policy Reform
 
Paris 2024 Olympic Geographies - an activity
Paris 2024 Olympic Geographies - an activityParis 2024 Olympic Geographies - an activity
Paris 2024 Olympic Geographies - an activity
 
Software Engineering Methodologies (overview)
Software Engineering Methodologies (overview)Software Engineering Methodologies (overview)
Software Engineering Methodologies (overview)
 
Activity 01 - Artificial Culture (1).pdf
Activity 01 - Artificial Culture (1).pdfActivity 01 - Artificial Culture (1).pdf
Activity 01 - Artificial Culture (1).pdf
 
Grant Readiness 101 TechSoup and Remy Consulting
Grant Readiness 101 TechSoup and Remy ConsultingGrant Readiness 101 TechSoup and Remy Consulting
Grant Readiness 101 TechSoup and Remy Consulting
 
SOCIAL AND HISTORICAL CONTEXT - LFTVD.pptx
SOCIAL AND HISTORICAL CONTEXT - LFTVD.pptxSOCIAL AND HISTORICAL CONTEXT - LFTVD.pptx
SOCIAL AND HISTORICAL CONTEXT - LFTVD.pptx
 
Web & Social Media Analytics Previous Year Question Paper.pdf
Web & Social Media Analytics Previous Year Question Paper.pdfWeb & Social Media Analytics Previous Year Question Paper.pdf
Web & Social Media Analytics Previous Year Question Paper.pdf
 
1029-Danh muc Sach Giao Khoa khoi 6.pdf
1029-Danh muc Sach Giao Khoa khoi  6.pdf1029-Danh muc Sach Giao Khoa khoi  6.pdf
1029-Danh muc Sach Giao Khoa khoi 6.pdf
 
Q4-W6-Restating Informational Text Grade 3
Q4-W6-Restating Informational Text Grade 3Q4-W6-Restating Informational Text Grade 3
Q4-W6-Restating Informational Text Grade 3
 

Process Instrumentation & Control

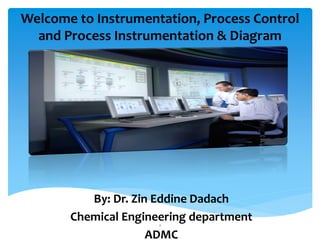
  • 1. Welcome to Instrumentation, Process Control and Process Instrumentation & Diagram By: Dr. Zin Eddine Dadach Chemical Engineering department ADMC 1
  • 2.  The first part of this course introduces the students to the basics of electrical circuit theory followed by the latest process instrumentation technology and selection criteria.  This section explains the measurement of common process variables such as temperature, pressure, level and flow and describe their corresponding sensors.  A lab experiment on calibrating a manometer. PART I: Instrumentation 2
  • 3. Define and explain the various circuit components and describe the basic of electronic theory. L.O. #1 3
  • 4.  SENSORS, TRANSMITTERS AND CONVERTERS ARE ELECTRICAL AND ELECTRONIC DEVICES THAT TRANSFORM PHYSICAL PROPERTIES (PRESSURE, PRESSURE DROP, DISPLACEMENT, HEAT..) INTO ELECTRICAL CURRENT  IT IS THEREFORE NECESSARY TO STUDY SOME BASIC THEORIES OF ELECTRICITY 4 THE NEED OF ELECTRONIC IN INSTRUMENTATION
  • 6. WHAT IS CURRENT?  Electrical current is the movement of charged particles in a specific direction  The charged particle could be an electron ,a positive ion or a negative ion  The charged particle is often referred to as a current carrier  In a solid, the current carrier is the electron  The symbol for current is I 6
  • 7.  An ammeter is a measuring instrument used to measure the flow of electric current in a circuit.  Electric currents are measured in amperes, hence the name.  The word "ammeter" is commonly misspelled or mispronounced as "ampmeter" by some. 7 AMMETER?
  • 8.  More modern ammeters are digital, and use an analog to digital converter to measure the voltage across the shunt resistor.  The current is read by a microcomputer that performs the calculations to display the current through the resistor. 8 MODERN AMMETERS
  • 9. Direct current (DC) is the unidirectional flow of electric charge. Direct current is produced by sources such as batteries, thermocouples, solar cells, and electric machines of the dynamo type. DC: Direct Current 9
  • 10.  In alternating current (AC), the movement of electric charge periodically reverses direction. While in direct current (DC), the flow of electric charge is only in one direction. Alternating Current 10
  • 11. 11
  • 12. WHAT IS A VOLTAGE? VOLT 12
  • 13. Voltage is the electric pressure OR POTENTIAL that causes current to flow. Voltage is also known as electromotive force or emf or potential difference. If there is no potential difference (V=0), there will be no current (I=0) 13 VOLTAGE =POTENTIAL
  • 14.  We need a unit to indicate the potential energy between two points such as terminals of a battery.  This unit must specify the energy available ( JOULE is unit for energy) when a charge ( COULOMB is unit for charge) is transported.  The unit of voltage is : Volt= joule/coulomb 14 UNIT OF VOLTAGE?
  • 15.  The moving coil galvanometer is one example of this type of voltmeter. It employs a small coil of fine wire suspended in a strong magnetic field.  When an electrical current is applied, the galvanometer's indicator rotates and compresses a small spring.  The angular rotation is proportional to the current that is flowing through the coil 15 OHMMETER OR GALVANOMETER
  • 17.  The opposition a material offers to electrical current is called resistance  All materials offer some resistance to current  Resistance converts electric energy into heat  The symbol for resistance is R  The unit of resistance is the Ohm (Ω) 17 WHAT IS ELECTRICAL RESISTANCE?
  • 18.  Conductance refers to the ability to conduct current.   It is symbolized by letter G  The base unit for conductance is the siemens or S  CONDUCTANCE IS THE EXACT OPPOSITE OF RESISTANCE  R=1/G or G=1/R 18 WHAT IS CONDUCTANCE?
  • 19.  Materials with a big resistance are : INSULATORS or RESISTORS  Examples of insulators : paper, wood, plastics, rubber, glass and mica  Materials with a small resistance are : CONDUCTORS  Examples of conductors : Copper, aluminum, silver 19 CLASSIFICATION OF MATERIALS
  • 20.  OHM’LAW: The relationship between current (I), voltage ( V) and resistance (R) was discovered by the german Georg OHM  I= V/R 20 OHM‘S LAW?
  • 21.  How much current ( I) flows in a circuit where the voltage is 2.8 V and there is a resistance of 1.4 Ω in the circuit? 21 CLASS WORK #1:
  • 22.  How much voltage is required to cause 1.6 amperes in a device that has 30 ohms of resistance?  The current flowing through a 10 kΩ resistor is 35mA. What is the potential energy difference ( voltage) across the resistor?  A lamp has a resistance of 96 ohms . How much current flows through the lamp when it is connected to 120 volts?  A manufacturer specifies that a certain lamp will allow 0.8 ampere of current when 120 volts is applied to it. What is the resistance of the lamp? 22 Home work #1
  • 24.  A great majority of electrical circuits operate more than one load. Circuits which contain two or more loads are called multiple-load circuits.  A multiple-load circuit can be a series circuit, a parallel circuit or a series-parallel circuit 24 INTRODUCTION
  • 25.  A series circuit is the simplest circuit.  The conductors, control and protection devices, loads, and power source are connected with only one path to ground for current flow.  The resistance of each device can be different.  The same amount of current will flow through each.  The voltage across each will be different.  If the path is broken, no current flows and no part of the circuit works 25 A SERIES CIRCUIT
  • 27. VT= V1 +V2+V3+…. IT=I1=I2=I3+…… RT= R1 +R2+R3+…. Calculations 27
  • 30.  A parallel circuit has more than one path for current flow.  The same voltage is applied across each branch.  If the load resistance in each branch is the same, the current in each branch will be the same.  If the load resistance in each branch is different, the current in each branch will be different.  If one branch is broken, current will continue flowing to the other branches 30 PARALLEL CIRCUIT
  • 32.  VT=V1=V2=V3=…  IT=I1+I2+I3+…  (1/RT)= (1/R1) +(1/R2)+ (1/R3)+… Calculations 32
  • 34. 1) THREE RESISTANCES ( 35, 70 AND 45 OHMS) IN SERIES WITH A VOLTAGE SOURCE OF 90V,  CALCULATE : IT,RT,VR1,VR2,VR3 2) WHAT IS THE TOTAL RESISTANCE OF A SERIE OF TWO RESISTORS 20, 30 OHMS IN PARALLEL WITH A SECOND SERIE OF RESISTORS 70, 80 OHMS? LISTEN..LEARN..THINK..ENJOY YOURSELF 34 HOME WORK
  • 35.  Electrical energy is undoubtedly the primary source of energy consumption in any modern household.  Most electrical energy is supplied by commercial power generation plants like Tawillah  The most common power generation plants are fueled by : Fuel gas or fuel oil 35 WHAT IS ELECTRICAL ENERGY?
  • 36.  When a current flows in a circuit with resistance, it does work.  Devices can be made that convert this work into heat (electric heaters), light (light bulbs and neon lamps), or motion (electric motors)  P=W/t  P is the power and the unit is watt,  W is energy in joules and t time in seconds  1 Watt = 1Joule/second. 36 GENERAL DEFINITION OF POWER (P)
  • 37.  Electric power, like mechanical power, is represented by the letter P in electrical equations, and is measured in units called watts (symbol W).  P = I .V  where  P = power in watts  I = current in amperes  V = potential difference in volts37 ELECTRICAL POWER
  • 38.  Joule's law can be combined with Ohm's law to produce two more equations:  P= I2.R  and  P=V2/R  where  R = resistance in ohms.  For example:  (2 amperes)2 × 6 ohms = 24 watts  and  (12 volts)2 / 6 ohms = 24 watts 38 ELECTRICAL POWER: OTHER FORMULAS
  • 39.  What is the power input to an electrical heater that draws 3 amperes from 120 volt outlet?  Find the power used by a resistor of 10 ohms when a voltage of 1.5 v is applied 39 CLASS WORK #2:
  • 40.  How much power is dissipated when 0.2 ampere of current flows through a 100 ohms resistor?  How much energy is taken from the battery by the resistor ( 10 ohms) if the voltage is 1.5 V and the switch is closed for 30 min?  What is the cost of operating a 100 watt lamp for 3 hours if the rate is 6 cents per kWh?  An electrical iron operates from 120 volts outlet and draws 8 amperes of current. At 9 cents per kWh , how much does it cost to operate the iron for 2 hours 40 HOMEWORK #2:
  • 41. Measuring resistances, currents and voltages using multi-meters. LAB #1: Basic electricity 41
  • 42. INSTRUMENTATION FIRST AND THE MOST IMPORTANT STEP OF PROCESS CONTROL 42
  • 43. INSTRUMENTATION USE SENSORS LIKE THERMOCOUPLES, PRESSURE AND FLOW SENSORS TO MEASURE THE DIFFERENT PARAMETERS IN THE PLANT.  INFORMATION IS SENT TO THE CONTROLLER ( IN THE CONTROL ROOM) TO TAKE APPROPRIATE ACTIONS. . 43 DEFINITION OF INSTRUMENTATION
  • 44.  Measurements have got to be one of the most important equipment in any processing plant.  Since successful process control requires appropriate instrumentation, engineers should understand the principles of common instruments. 44 GOOD INFORMATION=GOOD CONTROL
  • 45.  Like human body uses nerves, Sensors are used for process monitoring and for process control.  Sensors are essential elements of safe and profitable plant operation.  This can be achieved only if the proper sensors are selected and installed in the correct locations.  While sensors differ greatly in their physical principles, their selection can be guided by the analysis of a small set of issues . 45 INSTRUMENTATION USE SENSORS
  • 46.  TEMPERATURE  PRESSURE  LEVEL  FLOW 46 THE FOUR MOST IMPORTANT VARIABLES IN ANY INDUSTRIAL PLANT
  • 47. Explain theory and apply the principles of temperature measurement and select the appropriate sensor for the application and discuss their common operating and troubleshooting problems. L.O #2 47
  • 49.  The temperature is the most important variable in a chemical process. Very often, the temperature should be controlled very precisely like:  In a reactor where the reaction outcome depends on the temperature’  For safety reasons where explosions can occur  Therefore, temperature need to be measured precisely with a very accurate sensor. 49 INTRODUCTION
  • 50.  ITS-90 (International Temperature Scale of 1990- used as a worldwide practical temperature scale in national metrology labs like NIST, NPL et al). 50 INTERNATIONAL STANDARDS FOR TEMPERATURE MEASUREMENTS
  • 51. Fluids and solids are composed of atoms or molecules These atoms or molecules vibrate, rotate and move in general, the atoms have an average energy When is cold, they move slowly and the energy is low when it is hot, they move fast and the energy is high 51 WHAT IS TEMPERATURE?
  • 52.  SCALES ARE INTERNATIONAL STANDARDS USED IN ALMOST ALL THE COUNTRIES  CELSIUS SCALE OR CENTIGRADE SCALE:  FROM 00C ( melting ice) TO 1000C ( boiling water) at 1 atm.  KELVIN SCALE : 0 K = -2730C T (K)= T(0C) + 273 52 SCALES FOR TEMPERATURE
  • 53.  AMERICAN SCALE:  RELATIONSHIP BETWEEN FAHRENHEIT AND CELSIUS SCALES : 320F = 00C 2120F= 1000C  T(0F)= 1.8xT(0C) +32 53 FAHRENHEIT SCALE
  • 54.  RANKINE SCALE : T(0R) = T(0F) + 460 T(0R) = 1.8 x T(K) 54 RANKINE SCALE
  • 55.  Convert 1000C into :  K, 0F,0R  Convert 50 K into:  0C, 0F,0R  Convert -750F into:  0C, K, 0R  Convert 0 0R into:  0C,0F, K 55 HOME WORK
  • 56.  T = temperature  TI = Temperature Indicator ( in plant)  TT= Temperature Transmitter  TC= Temperature Controller  TRC= Temperature Recorder & Controller  TCV= Temperature Control Valve TAG DESCRIPTORS FOR TEMPERATURE 56
  • 57. RTD= RESISTANCE TEMPERATURE DETECTOR THERMISTOR= THERMAL RESISTORS THERMOCOUPLES Radiation pyrometers 57 TEMPERATURE SENSORS USED FOR PROCESS CONTROL SYSTEMS
  • 59.  A Resistance Temperature Detector (RTD) is a device with a significant temperature coefficient (that is, its resistance varies with temperature).  It is used as a temperature measurement device, usually by passing a low-level current through it and measuring the voltage drop. 59 DEFINITION OF A RESISTANCE TEMPERATURE DETECTOR
  • 60.  The relationship between the resistance of a RTD and the temperature of the medium is the temperature coefficient α of the RTD .  coefficient α is also the sensitivity of the RTD 60 TEMPERATURE COEFFICIENT α OF A RTD
  • 61.  α IS A LINEAR APPROXIMATION BETWEEN RTD RESISTANCE AND THE TEMPERATURE : R(T)= R(TO) { 1+ α.ΔT}  R(T)= approximation resistance at Temperature T  R(T0)= resistance of RTD at T0  ΔT = T-T0 α depends on R(T0) and α> 0 because Metal resistance increases with temperature61 TEMPERATURE COEFFICIENT α OF A RTD
  • 62. Platinum is very repeatable, quite sensitive and very expensive  For Platinum, coefficient α is around 0.004/0C  Example: for PRTD of 100 Ω, if the temperature increases by 10C, R(T) changes by 0.4 Ω Nickel is not quite as repeatable, more sensitive and less expensive  For Nickel, coefficient α is around 0.005/0C  Example: For RTD of 100 Ω, if the temperature increases by 10C, R(T) changes by 0.5 Ω 62 SENSITIVITY α OF DIFFERENT METALS
  • 63. RTD's are the best choice for repeatability, and are the most stable and accurate. However they have a slow response time and because they require a current source they do have a low amount of self heating. 63 ADVANTAGES & DISATVANTAGES OF RTDs
  • 64.  RTDs work in a relatively small temperature domain, compared to thermocouples, typically from about  -200 °C to a practical maximum of about 650 to 700 °C.  Some makers claim wider ranges and some construction designs are limited to only a small portion of the usual range. 64 RANGE OF TEMPERATURES FOR RTD
  • 65.  A special set of RTD’s are called PRT’s because they use platinum are a material  A special set of PRTs, called SPRTs, are used to perform the interpolation in such labs over the ranges 13.8033 K (Triple point of Equilibrium Hydrogen) to the Freezing point of Silver, 971.78 °C. 65 RANGE OF TEMPERATURE FOR PRT ( PLATINUM RESISTANCE TEMPERATURE)
  • 67.  Thermistors are temperature sensors that use semiconductor materials not metals like RTD’s  R(T) = R(T0) {1+ α (T-T0)} Semiconductors for temperature sensing have Negative Temperature Coefficient (NTC) OR α< 0  Semiconductor becomes a better conductor of current. Resistance decreases when the temperature increases. 67 DEFINITION OF THERMAL RESISTORS
  • 68.  The characteristics of these devices are very different from those of RTD’s  Thermistors are the most sensitive and fastest temperature measurement devices.  Thermistors can be used for small range of temperatures  Thermistors are non-linear . 68 PROPERTIES OF THERMISTORS
  • 69.  Because the resistance become too high at low temperature, the low limit is -1000C  Because the semiconductor can melt or be deteriorated at high temperatures, the high limit is 3000C  In most cases, the thermistor is encapsulated in plastic , epoxy, Teflon or some other material to protect the thermistor from the environment 69 THERMISTOR’ S LIMITATIONS
  • 70.  Thermistors have a fast output and are relatively inexpensive but are fragile and have a limited range. They also require a current source and do experience more self heating than an RTD and are nonlinear. ADVANTAGES & DISADVANTAGES OF THERMISTORS 70
  • 72.  When a pair of dissimilar metals are joined together for the purpose of measuring temperature, the device formed is called a thermocouple.  Thermocouples for instrumentation use metals of high purity for an accurate temperature/voltage relationship (as linear and as predictable as possible).  Thermocouples cover a range of temperatures from -2620C to 27600C 72 DEFINITION OF THERMOCOUPLES
  • 74.  Thermocouples suffer from 2 major problems that cause errors when using them 1) Small voltage generated EX: 10C temperature change on a platinum thermocouple results of an output change of 5.8 μV 2) the non-linearity that requires polynomial conversion 74 PROBLEMS OF THERMOCOUPLES
  • 75.  The voltage (emf) produced by a heated junction of two wires is directly proportional to the temperature.  This fairly linear relationship is called SEEBECK EFFECT  Thus, the Seebeck effect provides for us an electric method of temperature measurement  RTD’S AND THERMISTORS USE RESISTANCES FOR MEASUREMENT BUT THERMOCOUPLES USE VOLTAGE 75 SEEBECK EFFECT
  • 76. ε = α. ( T2-T1) WHERE: ε= THE EMF TYPES OF THERMOCOUPLES α = SEEBECK COEFFICIENT T2 ,T1= JUNCTION TEMPERATURE IN K 76 SEEBECK COEFFICIENT
  • 77.  K = Chromel-alumel Temperatures : -190 to 13710C Seebeck Coefficient= 40 μV/0C J = Iron-constantan Temperatures : -190 to 7600C Seebeck Coefficient= 50 μV/0C 77 TYPES OF THERMOCOUPLES
  • 78.  T = Copper-constantan Temperatures: -190 to 7600C Seebeck coefficient : 50 μV/0C E = Chromel-constantan Temperatures : -190 to 14720C Seebeck coefficient: 60 μV/0C 78 TYPES OF THERMOCOUPLES
  • 79.  S= Platinum- 10% Rhodium/Pt Temperatures: 0 to 17600C Seebeck Coefficient: 10 μV/0C R = Platinum-13%Rhodium/Pt Temperatures: 0 to 16700C Seebeck coefficient : 11 μV/0C 79 TYPES OF THERMOCOUPLES
  • 80.  Thermocouples are inexpensive, rugged, and have a fast response time but are less accurate and the least stable and sensitive. Thermocouples also read only relative temperature difference between the tip and the leads while RTD's and thermistors read absolute temperature. ADVANTAGES AND DISDVANTAGES OF THERMOCOUPLES 80
  • 81. Temperature Measurement Comparison Chart Criteria Thermocouple RTD Thermistor Temp Range -267°C to 2316°C -240°C to 649°C -100°C to 500°C Accuracy Good Best Good Linearity Better Best Good Sensitivity Good Better Best Cost Best Good Better COMPARISON BETWEEN THE DIFFERENT TEMPERATURE SENSORS Temperature Measurement Comparison Chart 81
  • 82. Find the seebeck emf (ε) for a thermocouple J with α. = 50 μV/0C if the junction temperatures are 20 and 1000C 82 CLASS WORK
  • 83.  Objective of the lab: I) During the experiment: Reading of the temperature of the water being heated and the corresponding values for the three temperature sensors. II) After the lab, draw the three different calibration curves and find the sensitivity factor α for each sensor using the corresponding formula.  RTD = Resistance vs. Temperature  Thermistors: Resistance vs. temperature  Thermocouples = Voltage vs. Temperature  III) Write a lab report LAB #2 TEMPERATURE SENSORS 83
  • 84. EX: CALIBRATION CURVE OF THERMOCOUPLE 84
  • 85. Explain theory and apply the principles of pressure measurement and select the appropriate sensor for the application and discuss technical issues including calibration. L.O #3 85
  • 87.  Pressure is the second most important measurement in process control  Pressure is controlled for process reason but also for safety reason.  The most familiar device are manometers and gauges but they require a manual operator 87 IMPORTANCE OF PRESSURE
  • 88. DEFINITION OF PRESSURE  PRESSURE IS THE AMOUNT OF FORCE EXERTED ON A UNIT AREA OF A SUBSTANCE: A F P  88
  • 89.  P= Pressure  PI= Pressure Indicator  PT= Pressure Transmitter  PC= Pressure controller  PRC= Pressure Recorder & Controller  PCV= Pressure Control Valve  PSV= Pressure Safety Valve  PRV= Pressure Relief Valve. TAG DESCRIPTORS FOR PRESSURE
  • 90.  SI UNITS: 1Pa = 1N/M2=1KG/S2.M 1ATM (ATMOSPHERIC PRESSURE)= 1.01x10⁵ Pa 1 ATM= 101 kN/M2 1ATM= 760 MM. HG  US UNITS: 1PSIA = 1LBF/IN2 1PSIA = 6894.7 Pa 1ATM= 14.696 PSIA 90 UNITS OF PRESSURE
  • 91.  STATIC PRESSURE IS FOR A FLUID WITH IS NOT IN MOTION EX: FLUID IN A TANK  DYNAMIC PRESSURE IS FOR A FLUID IN MOTION IN PIPES 91 STATIC VS DYNAMIC PRESSURE
  • 92.  P= F/S  F= m.g  P= mg/S = (mgxh)/ (Sxh) =( mgh/V) m/V= ρ  P= ρ.g.h 92 Hydrostatic or Static pressure
  • 93.  THE PRESSURE OF A FLUID IN A PIPE IS MEASURED BY A PRESSURE GAUGE.  FLOW CALCULATED BY BERNOUILLI EQUATION 93 DYNAMIC PRESSURE
  • 94.  IT IS EXTREMILY IMPORTANT TO MAKE THE DIFFERENCE BETWEEN THE ABSOLUTE AND RELATIVE PRESSURE  THE ABSOLUTE PRESSURE IS THE REAL PRESSURE OF THE FLUID WHERE THE RELATIVE PRESSURE IS THE PRESSURE WE READ IN A PRESSURE INDICATOR WITH REFERENCE THE ATMOSPHERIC PRESSURE 94 ABSOLUTE AND GAUGE PRESSURE
  • 95.  PA = PG + 1 ATM  EXAMPLE #1 :EXPRESS A PRESSURE GAUGE OF 155 KPa TO ABSOLUTE PRESSURE WHEN THE ATMOSPHERIC PRESSURE IS 98 Kpa  EXAMPLE #2: WHICH PRESSURE DO YOU READ IN A GAUGE MANOMETER FOR A PRESSURE OF 225 KPa ( ABSOLUTE ) WHEN ATMOSPHERIC PRESSURE IS 101 KPa 95 RELATIONSHIP BETWEEN PA AND PG CLASS WORK
  • 96. In many cases, gauge pressure is more important than the absolute pressure because we read gauge pressure in manometers.  Pg= Pabs- Patm 96 GAUGE PRESSURE
  • 98.  PRESSURE IS USUALLY MEASURED FOR INDICATION ONLY BY READING:  GAUGES  U TUBES 98 PRESSURE INDICATORS
  • 99.  A hard metal tube ( bronze or brass) is flattened and one end is closed. Under pressure, the tube is bent into a curve or arc.  The open end is attached to a header by which the pressure can ne introduced inside the tube 99 MANOMETER= GAUGE OR BOURDON TUBE
  • 102. I) A tank open to atmosphere holds water with a depth of 7 m. Density of water = 1000 kg/m3 a) What is the pressure in a gauge at the bottom of the tank in Pa ? b) Draw the figure showing the manometers readings 102 CLASS WORK
  • 103.  in a closed tank under vacuum, the bottom pressure of an unknown liquid at 1.2 m depth is 12.55 kPa (absolute).  1) Draw a figure showing the manometer readings  2) What is the density of the fluid?  A crude oil, in a tank at 60 kPa top absolute pressure, has a specific gravity of 0.89 and a pressure of the bottom of 345 kPa ( gauge).  1) Draw a figure showing the manometer readings  2) What is the level of the oil in the tank ?  A fluid in a tank has a specific gravity of 0.76 and a absolute pressure at the top 150 kPa and a gauge pressure at the bottom of 140 kPa.  1) Draw a figure showing the manometer readings  2) What is the level of liquid in the tank? HOMEWORK 103
  • 104.  CALIBRATION OF A MANOMETER BY MEASURING THE PRESSURE OF A GIVEN WEIGHT USING A HYDRAULIC OIL  USE DIFFERENT WEIGHTS READ THE PRESSURES IN THE MANOMETER  APPLY THE FORMULA (P=m.g/S) COMPARE the reading with the calculated PRESSURE and calculate the error 104 LAB #3 : calibration of manometers
  • 106. Explain theory and apply the principles of level measurement and select the appropriate sensor for the application instruments and discuss technical problems including calibration. L.O #4 106
  • 107. In any chemical plant, you will find tanks, reservoirs, vessels and drums where liquids are stored. These could be for: The feed of the plant Intermediate between sections The products before selling them Liquid capacities are also found in distillation columns and reactors 107 LIQUID CAPACITIES IN A CHEMICAL PLANT
  • 108. Level of liquid in a vessel should be maintained above the exit pipe because if the vessel empties the exit flow will become zero, a situation that could damage PUMPS. A minimum level of liquid is then necessary to avoid cavitation of the pump This minimum should be known (measured) and respected during the production 108 MINIMUM LEVEL
  • 109.  The level should also have a maximum value to:  not overflow an open vessel (safety for workers)  should not exit through a vapor line of a closed vessel, which could disturb a process designed for vapor ( safety for COMPRESSOR , TURBINES) 109 MAXIMUM LEVEL
  • 110.  L= Level  LI= Level Indicator  LT= Level Transmitter  LC= Level controller  LRC= Level Recorder & Controller  LCV= Level Control Valve  LLA and VLLA: Low level Alarm and Very…  HLA and VHLA: High Level Alarm and Very.. TAG DESCRIPTORS FOR LEVEL 110
  • 111.  Level measurement sensors are divided into two categories:  point level switches for ALARMS  continuous level gauges for CONTROL 111 LEVEL MEASUREMENT SENSORS
  • 112.  Point level is used mostly for SAFETY.  Will operate when the liquid is above or below a certain point.  Switches devices indicate when a vessel is full, empty or at intermediate level  You will have LLA ( low level Alarm) and HLA ( high level Alarm) 112 POINT LEVEL SWITCHES
  • 113. Continuous level gauges provide information about material level at all points in the vessel Continuous level gauges are used for control purpose 113 CONTINUOUS LEVEL GAUGES
  • 114.  Pressure ( hydrostatic)  Float  Nuclear  ultrasonic 114 SENSORS FOR CONTINUOUS LEVEL MEASUREMENT
  • 115.  Float  Capacitance  Conductive level probes  Thermal & light beam 115 SENSORS FOR POINT LEVEL MEASUREMENT
  • 117.  The differential pressure is the most commonly used for continuous level measurement of liquids.  a membrane is used where the value  H(Level)= ΔP/ρ.g 117 LEVEL MEASUREMENT BY HYDROSTATIC PRESSURE
  • 118. 118 TANK OPEN TO ATMOSPHERE
  • 120.  A tank open to atmosphere holds water. The pressure at the bottom is 200 kPa ( absolute) 1) Draw the figure showing the tank and the differential pressure ’s reading 2) What is the level in the tank ?( density of water = 1000 kg/m3)  In a closed tank under vacuum and containing crude oil ( ρ= 780 kg/m3) , the bottom pressure is 12.55 kPa (absolute). 1) Draw a figure showing the tank and the differential pressure ’s reading. 2) What is the level in the tank?120 Class Work
  • 121.  A crude oil, in a tank at 120 kPa top absolute pressure, has a specific gravity of 0.80 and a gauge pressure of the bottom of 345 kPa . 1) Draw a figure showing the tank and the differential pressure s reading. 2) What is the level in the tank?  A fluid in a tank has a specific gravity of 0.65 and a gauge pressure at the top 150 kPa and a absolute pressure at the bottom of 140 kPa. 1) Draw a figure showing the tank and the differential pressure ’s reading. 2) What is the level of liquid? HOME WORK 121
  • 123. Explain theory and apply the principles of flow measurement and select the appropriate sensor for the application and discuss technical problems including calibration. L.O #5 123
  • 124.  Quantity of fluid flowing in a system by unit time.  This quantity can be expressed in three ways:  Volume Flow rate ( Q) :Bring a flask and a stop watch to measure volumetric flow Mass Flow rate ( M)  Weight Flow rate ( W) 124 WHAT IS FLOW?
  • 125. F= Flow FI= Flow Indicator FT= Flow Transmitter FC= Flow controller FRC= Flow Recorder & Controller FCV= Flow Control Valve TAG DESCRIPTORS FOR LEVEL 125
  • 126.  If we know the volume flow rate Q, we can calculate the mass flow rate by : M=ρ.Q  If we know the volume flow rate Q, we can calculate the weight flow by : W=γ.Q 126 RELATIONSHIP BETWEEN FLOWS
  • 127.  The volume flow rate is the volume of fluid flowing past a section per unit time  In a pipe, we can have the relation: Q=A .v (where v is the average velocity of flow)  Units used: SI : EX: v (m /s)  Q (m3/s) US : EX: v (ft /s)  Q(ft3/s) 127 Volume flow rate Q
  • 128.  An average flow rate of water produced by a plant is 11600 m3 /hr. Find the equivalent flow rate in m3/s, mass flow rate in kg/s ( density of water = 1000 kg/m3) and the weight flow rate ( Weight= Mass x gravity) and gravity = 9.8 m/s2 128 CLASS WORK (units)
  • 129.  A) MATERIAL BALANCE OF A PLANT: VERY VERY IMPORTANT  Measure flow of feeds Measure flow of products We should have : IN=OUT in mass ( Otherwise we have leaks in the plant)  B) FLOW IS A IMPORTANT VARIABLE FOR THE SYSTEM ( EX:REACTOR)  WHEN YOU HAVE A RATIO CONTROL SYSTEM 129 WHY WE NEED TO MEASURE FLOWS
  • 130.  In the instrumentation market, we find two types of flow-meters:  Energy-extractive Flow meters Energy additive Flow meters 130 FLOW MEASUREMENT TECHNIQUES
  • 131.  Several sensors rely on the pressure drop or head occurring as a fluid flows by a resistance. 131 THE PRINCIPLE OF FLOW SENSORS
  • 132.  ORIFICE  VENTURI TUBE  FLOW NOZZLE  ELBOW METER  PITOT TUBE  TURBINE 132 MOST IMPORTANT FLOW SENSORS
  • 133. Bernouilli Equation  Old system : use low measurement devices that reduce the energy of the system. The differential pressure is used to measure flow using Bernoulli equation:  Applying Continuity equation: QA=QB ( assuming constant density). Find the relationship between flow ( You want to estimate) and ΔP ( your readings).  this relationship is used in Energy extractive flow meters as a conversion factor 22 2 1 2 1 BB B AA A v g z p v g z p   133
  • 134.  From Bernouilli Equation:  𝑄 = ∆𝑃. 2( 𝐴1. 2 𝐴2 2 ) 𝜌(𝐴1 2 −𝐴2 2) Pressure drop in Pa Area in m2 Density in kg/m3 Q in m3/s Calculating volumetric flow rate Q 134
  • 135.  In a pipe of 0.3 diameter, water is flowing at 600C. We use a venturi tube to measure the flow rate. The venturi tube has a diameter of 0.2 m and we observe a pressure drop of 50 pa  What is the volume flow rate and the conversion factor?  What is the mass flow rate? 135 CLASS WORK
  • 137.  Define the terms used in chemical process control and discuss the role and importance of process control systems in industrial plants.  Define P, PI and PID controllers  Explain feedback control and the dynamic behavior of this controller.  Apply the principles of feed-forward and show how this type of control can be applied.  Describe how the principles of cascade control, ratio, the selective control and split - range control are used in processes control.  Define the principles of computer control and distinguish between direct digital control and supervisory control.  Do experiments and write laboratory reports in a professional manner. PART II: PROCESS CONTROL 137
  • 138. L.O #1 Define the terms used in chemical process control and discuss the role and importance of process control systems in industrial plants. 138
  • 139. 139 THE SEVEN OBJECTIVES OF A CONTROL SYSTEM • 1. Safety • 2. Environmental Protection • 3. Equipment protection • 4. Smooth Operation and production rate • 5. Product Quality • 6. Profit • 7. Monitoring and Diagnosis
  • 140. Example  Heating up the temperature in the tank is a process that has the specific, desired outcome to reach and maintain a design value for the temperature (e.g. 80°C), kept constant over time.  The desired temperature (80°C) is the set point. The controller will manipulate the valve of hot water to maintain the room temperature at 800C. 140
  • 142. 142WHAT ARE THE DESIGN VALUES?  THE DESIGN ENGINEERS CALCULATE THE VALUES OF SOME VERY IMPORTANT VARIABLES OF THE PROCESS THAT SHOULD BE MAINTAINED CONSTANT IN ORDER TO GIVE MAXIMUM PROFITABILITY BY RESPECTING SAFETY AND ENVIRONMENT ( OPTIMIZATION)  THESE CALCULATED VALUES ARE THEN INTRODUCED AS SET POINTS ( VALUES TO BE RESPECTED) IN THE CONTROLLER ONCE THE PLANT IS BUILT .
  • 143. 143 HOW ARE THE VALUES OF THE IMPORTANT VARIABLES ( SET POINTS) MADE CONSTANT? ACTING ON SOME OTHER LESS IMPORTANT VARIABLES OF THE PROCESS IN ORDER TO SUPPRESS THE EFFECTS OF EXTERNAL DISTURBANCES ON THE IMPORTANT VARIABLES
  • 145. Overview of Process Automation The process is “that portion of an automation operation which use energy measurable by some quality such as pressure, temperature, level, flow, (and many others) to produce changes in quality or quantity of some material or energy.” PROCESS Some Quality or Quantity of the Material or Energy Input Energy or Material Desired Result
  • 146. Example of a Temperature Process Heating Element Water Bath Temperature The objective of this process is to maintain a constant water bath temperature.
  • 147. Temperature Process Terminology Heating Element Water Bath Temperature This is a Temperature Process The measuring means is the thermometer. (Temperature Indicator- TI) The process temperature is maintained at a desired point (Set Point – SP) Steam (Control Agent) is used to vary the temperature by opening and closing the control valve (Final Control Element)
  • 148. Level Process Oil Stock Level Indicator Oil Feed to next process The control objective is to maintain a constant liquid level of oil inside the tank (e.g. 100 gallons +/- 20 gallons). The hand valve is opened and closed as required to maintain the desired tank level.
  • 149. Terminology used to describe the process  PROCESS: Level  CONTROLLED VARIABLE: Level by Head pressure at bottom of tank  CONTROL POINT: The level of oil in the tank (Set Point = 100 gallons)  MEASURING MEANS: Level Indicator (Head Pressure)  MANIPULATED AGENT: Volume of oil stock  MANIPULATED VARIABLE: Flow rate of oil (gpm) Oil Stock Level Indicator Oil Feed to next process
  • 150. Basic Model of a Process The process is maintained at the desired point (SP) by changing the FCE based on the value of the PV Manipulated Variable Desired Result Control Agent PROCESS (Temperature, pressure, level, flow) FINAL CONTROL ELELMENT (valve) Measuring Means (transmitter) Process Variable (PV) Controlled Variable Actuating Input pH, conductivity, humidity, density, consistency, etc. Process equilibrium (balance) is when the input energy maintains the output at a constant “desired” point.
  • 151. Basic Model of a Process The measuring means provides the standardized signal that represents the condition of the process, i.e. is the process at the desired point? Manipulated Variable Desired Result Control Agent PROCESS (Temperature, pressure, level, flow) FINAL CONTROL ELELMENT (valve) Measuring Means (transmitter) Process Variable (PV) Controlled Variable Actuating Input pH, conductivity, humidity, density, consistency, etc.
  • 152. Review of Measuring Means Pressure Level Flow Temperature Thermocouples RTDs / Thermistors Filled Systems Bi-metallic Strain gauge Piezo-electric Capacitance Bourdon Tube Head meters (orifice, venturi) Coriolis, velocity, Mass, Mechanical Floats Guided Wave Weight (load cell) Ultrasonic Differential Pressure Transmitters Pressure Transmitter Level Transmitter Differential Pressure Cell Flow Transmitter Temperature Transmitter Pneumatic 3-15 PSI Electrical Current 4 – 20 mA 0 – 20 mA 10 – 50 mA Voltage 0 – 5 V 1 – 5 V 0 – 10 V Digital ON/OFF Field Bus ModBus ProfiBus HART
  • 153. Manual Control Open loop (or manual control) is used when very little change occurs in the Process Variable (PV) Manipulated Variable Desired Result Control Agent PROCESS (Temperature, pressure, level, flow) FINAL CONTROL ELELMENT (valve) Measuring Means (transmitter) Process Variable (PV) Controlled Variable Actuating Input pH, conductivity, humidity, density, consistency, etc. Corrective action is provided by manual feedback
  • 154. THE FOUR BASIC STEPS OF A PROCESS CONTROL SYSTEM HOW DOES IT WORK? 154
  • 155. 155 THE FIRST STEP: TAKING THE INFORMATION  IF WE DO NOT KNOW WHAT IS WRONG, HOW CAN WE CONTROL ? TAKING INFORMATION OF THE IMPORTANT VARIABLES ( Design Values) OF THE PROCESS.
  • 156. 156IN OUR CASE:  Temperature of the tank has to be controlled.  Temperature SHOULD FIRST BE MEASURED. THE EQUIPMENT FOR temperature MEASUREMENT IS : thermocouple
  • 157. 157 THE SECOND STEP OF A PROCESS CONTROL SYSTEM: TRANSMISSION OF THE INFORMATION  LINK BETWEEN THE PLANT AND THE CONTROL ROOM)  THE MEASUREMENT OF THE CONTROLLED VARIABLE IS SENT TO THE CONTROLLER IN THE CONTROL ROOM. THE EQUIPMENT FOR TRANSMISSION IS THE TRANSMITTER Thermocouple is also a transmitter
  • 158. IN OUR CASE: THE ANALOG SIGNAL OF THE VALUE OF FB ( MEASURED VARIABLE) IS TRANSMITTED TO A/D CONVERTER THE RESULTING DIGITAL SIGNAL IS SENT TO THE CONTROLLER (digital or computer software)  WHY A/D CONVERTER? 158
  • 159. 159 THE THIRD STEP :THE CONTROLLER MAKE DECISION THE THIRD STEP IS THE CONTROLLER IN THE CONTROL ROOM  THE CONTROLLER: 1) RECEIVE THE INFORMATION FROM THE PLANT 2) COMPARE IT WITH THE SET POINT 3) CALCULATE THE DIFFERENCE ε BETWEEN THE SET POINT AND THE INFORMATION. 4) MAKE A DECISION FOR ACTION TO BE TAKEN IN THE PLANT.
  • 160. IN OUR CASE: THE CONTROLLER WILL FIRST COMPARE T ( MEASURED VARIABLE) TO ITS SET POINT TSP.  THE CONTROLLER WILL THEN CALCULATE THEIR DIFFERENCE ε =( TSP-T)  THIS DIFFERENCE ε IS MULTIPLIED BY A FACTOR K DEPENDING ON THE TYPE OF CONTROLLER ( P,PI OR PID TO BE STUDIED LATER) 160
  • 161. 161 THE FOURTH STEP: ACTION ON A CONTROL VALVE OR MOTOR IN THE PLANT A SIGNAL FROM THE CONTROLLER, RELATED TO THE DIFFERENCE ε IS SENT TO THE VALVE TO MANIPULATE THE FLOWRATE OF STEAM WHICH IS A LESS IMPORTANT VARIABLE THE VALVE IS THE FOURTH AND LAST EQUIPMENT OF THE PROCESS CONTROL SYSTEM  THE FLOW OF STEAM IS THE MANIPULATED VARIABLE.
  • 162. 162IN OUR CASE  TO ELIMINATE THE EFFECTS OF THE SURRONDINGS ( DISTURBANCES) ON THE IMPORTANT VARIABLE TEMPERATURE WHICH IS MEASURED  TO BRING T AS CLOSE AS POSSIBLE TO ITS SET POINT VALUE TSP THE CONTROLLER ACT ON ANOTHER VARIABLE FA CALLED MANIPULATED VARIABLE
  • 163. 163BLOCK DIAGRAM OF A PROCESS CONTROL SYSTEM
  • 164. CLASS WORK  We want to produce ammonia from nitrogen and hydrogen in a reactor where the temperature should be maintained constant by a coolant in a jacket around the reactor.  Draw the process  Draw the process control system  Show the FOUR steps of the control loop 164
  • 166. EXAMPLE OF OPEN LOOP SYSTEM : SYSTEM WITH NO CONTROL level LISTEN..LEARN..THINK..ENJOY YOURSELF 166 166
  • 167. LEVEL WITH SET POINT BUT NO CONTROL  LEVEL2 LISTEN..LEARN..THINK..ENJOY YOURSELF 167 167
  • 168. A SYSTEM WITH CONTROL CLOSED LOOP 168
  • 169. 169A) MANUAL CONTROL  DURING START UP AND SHUT DOWN: OPERATOR CONTROL THE PLANT OPERATIONS  LEVEL3
  • 170. 170 AUTOMATIC CONTROL  DURING OPERATING CONDITIONS: THE CONTROLLER TAKES ACTIONS  ON AND OFF CONTROLLER:  CONTROLLER TAKES ACTION ONLY WHEN THE MINIMUM AND THE MAXIMUM OF THE LEVEL ARE REACHED  NOT USED VERY OFTEN ONLY IN SIMPLE SITUATIONS WHEN SAFETY AND PRODUCTIVITY ARE NOT AFFECTED  LEVEL4
  • 171. 171CONTINUOUS AUTOMATIC CONTROL:  THE MOST USED CONTROLLERS: PROPORTIONAL ( P)  PROPORTIONAL- INTEGRAL ( PI)  PROPORTIONAL-INTEGRAL-DERIVATIVE ( PID)
  • 172. 172CONTROL SYSTEM: P,PI,PID  CHANGE THE SET POINT OF THE LEVEL AND OBSERVE THE BEHAVIOR OF THE PROCESS  LEVEL5
  • 173. THE DIFFERENT FUNCTIONS OF A PROCESS CONTROL LOOP Between the measuring device and the final control element, we have different steps and each step has its own function  THE SENSOR : the output ym(t) of the sensor is related to the real value in the controlled variable y (t) by a transfer function  THE TRANSMITTER : The value yt (t) entering the controller is related to ym(t) by a transfer function ( we have delay in the information) LISTEN..LEARN..THINK..ENJOY YOURSELF 173 173
  • 174. DIFFERENT FUNCTIONS  THE CONTROLLER : after comparing to the set point ySP , the input to the controller is then ε (t) = ySP- ym(t). The output c(t) is related to ε (t) by a transfer function of the controller (P,PI,PID) The way c(t) and ε (t) are related depends on the type of controller ( TO BE STUDIED LATER)  THE VALVE: The output signal of the valve is related to c(t) by a transfer function depending on the type of the valve LISTEN..LEARN..THINK..ENJOY YOURSELF 174 174
  • 175. Lab #4:Demonstration lab  Demonstration lab for the pressure controller including:  1) The four steps  2) Converters P/I , I/P for electronic Controllers  3) A/D and D/A converters for digital controllers 175
  • 176. VIDEO FOR BASIC STEPS 176
  • 177. Closed Loop Control Closed loop or feedback control provides a corrective action based on the deviation between the PV and the SP Automatic Controller Output (3-15 psi, 4-20mA etc) CONTROLLING MEANS Manipulated Variable Desired Result Control Agent PROCESS (Temperature, pressure, level, flow) FINAL CONTROL ELELMENT (valve) Measuring Means (transmitter) Controller Input (PV) (3-15psi, 4-20mA etc) Controlled Variable pH, conductivity, humidity, density, consistency, etc. Manual SP
  • 178. Controlling Means Controllers provide the required control action to position the FCE at a point necessary to maintain the PV at the desired SP. PID (single loop feedback controller) DCS (distributed controllers) PLC (programmable logic controllers)
  • 179. Single Loop Feedback Control 1. Measuring Means 2. Controlling Means 3. Final Control Element 4. Temperature Process Temperature Controller and Recorder Sensing Bulb Temperature Transmitter Pneumatic Control Valve Heat Exchanger Steam 2 3 4 1 The TT provides the signal (PV) that represents the condition of the process being controlled. The TIC compares the PV to the SP and opens and closes the FCE to maintain the process at equilibrium.
  • 180. Summary  Process automation makes use of instrumentation to maintain the process at some desired condition.  Common instrumentation used in a process loop are the measuring means (usually transmitters), the controlling means (usually a PID controller), and the Final Control Element (usually some type of valve)  The measuring means provides the feedback signal (PV) used in the process loop. The controlling means operates the FCE based on the difference between the PV and the SP.  Process equilibrium is maintained when the difference between the PV and SP is zero or constant (offset?)
  • 181. NEXT? What are transmitters? What is PID? What are P&ID symbols? What types of FCE are there? What am I doing here? How do I measure? Pressure Level Temperature Flow How do I tune a loop? What is Integral action? What is a? FIC TT LRC PRV Should I use a 3-15 psi or 4- 20 mA valve? Check out
  • 183.  In the context of industrial process control, a "transmitter" is a device that converts sensor measured units into an electrical signal then directs this data (via cabling or wirelessly) to be received by a display or instrumentation control device within the system. 183 Transmitters
  • 184.  Analog transmitters are the most commonly used type in most industrial sectors. The transmitter is connected to the rest of the system via 2 wires which create something know as the 'current loop.'  The two wires can be used for both powering the unit and for transmitting signals typically at a range of 4 mA to 20 mA 184 Analog Transmitter
  • 185.  In an increasing number of industrial situations wireless sensors are an appropriate upgrade to classic industrial transmitters. This is because current of generation sensors offer flexible system solutions which are ideal for temporary installations and in processes with moving parts/objects.  Such wireless sensor networks can be comprised of hundreds or thousands of intelligent sensors. This allows for complex network mapping that can provide advanced solutions to today's processing environments. 185 Wireless transmitters
  • 186.  If the measuring device is pneumatic and the controller is electronic: A P/I transducer is needed to transform a physical movement into electrical current.  The I/P transducer does the opposite direction but not very used because most controllers are now electronic or digital. 186 Transducers: P/I and I/P
  • 187. If the controller is digital and the measuring device is pneumatic, we need:  1) convert pneumatic into electrical by P/I transducer  2) convert electrical to digital using A/D converter. At the exit of the digital controller we need:  1) D/A is the valve is electrical  2) D/A + I/P is the valve is pneumatic 187 Converters: A/D and D/A
  • 188. Define P, PI and PID controllers L.O #2: CONTROLLERS 188
  • 189. CONTROLLERS THE HEART OF PROCESS CONTROL LOOP 189
  • 190.  P CONTROLLER IS PROPORTIONAL CONTROLLER  PI CONTROLLER IS PROPORTIONAL CONTROLLER WITH INTREGRAL ACTION  PID CONTROLLER IS PROPORTIONAL CONTROLLER WITH INTEGRAL ACTION AND DERIVATIVE ACTION. DIFFERENT KINDS OF CONTROLLERS 190
  • 191. PROPORTIONAL CONTROLLER The proportional CONTROLER means that the controller output c(t) is linearly related to the error ε (t) The proportional controller has a gain Kc or Proportional Band (PB) related by the formula (Kc= 100/PB) LISTEN..LEARN..THINK..ENJOY YOURSELF 191 191
  • 192. Chapter 15 - Process Control Methods 192 Proportional Band  Proportional band is defined as the percentage change in the controlled variable that causes the final correcting element to go through 100 percent of its range PB = Controlled Variable % Change FinalCorrecting Element % Change
  • 193. PROPORTIONAL ACTION  The proportional action means that the controller output c(t) is linearly related to the error between set point (SP) and measurement of process output ym (t) : c(t) = Kc .ε(t) = Kc (SP – ym(t) )  The proportional gain Kc of a analog controller can be adjusted by knob in the controller.  Direct or reverse actions ? LISTEN..LEARN..THINK..ENJOY YOURSELF 193
  • 194. SIGN OF THE GAIN KC If he controller is direct acting  the gain K is positive. When the controller is reverse acting  the gain K is negative LISTEN..LEARN..THINK..ENJOY YOURSELF 194
  • 195. PROPORTIONAL BAND  Proportional controllers are defined by their Proportional Band (PB) or the proportional gain (Kc)with PB =100/Kc  For pneumatic valves, we define Kcp which is the output from the controller to the valve. The range of the instrumentation pressure for pneumatic valves is 3 -15 psia.  For electrical valves, we define Kce which is the output from the controller to the valve. The range of the instrumentation current for electrical valves is 4-20 mA. LISTEN..LEARN..THINK..ENJOY YOURSELF 195
  • 196. DIFFERENT SITUATIONS:  A) IF A FULL CHANGE IN THE CONTROLLED VARIABLE IS ALSO A FULL RANGE FOR THE VALVE , WE WILL HAVE: PB= 100%/100%= 1= 100% ,KC=1  IF WE ARE CONTROLLING TEMPERATURE FOR A RANGE OF 60-100, WE WILL HAVE : Kcp = 0.3 PSIA/ DEGRE LISTEN..LEARN..THINK..ENJOY YOURSELF 196
  • 197.  B) IF A 10% CHANGE IN THE CONTROLLED VARIABLE GIVES A FULL RANGE IN THE 100% IN THE VALVE, WE WILL HAVE PB= 10%/100% = 10% IF WE CONTROL TEMPERATURE FOR THE SAME TOTAL RANGE, 10% WILL BECOME 4 DEGRE AND WE WILL HAVE Kcp= 3PSIA/DEGRE THE CONTROLLER IS MORE SENSITIVE LISTEN..LEARN..THINK..ENJOY YOURSELF 197
  • 198.  C) IF A 100% CHANGE IN THE CONTROLLED VARIABLE GIVES A 20% RANGE IN THE VALVE, WE WILL HAVE PB= 100%/20% = 500%, KC=0.2 IF WE CONTROL THE SAME TEMPERATURE , WE WILL HAVE Kcp= 0.06 PSIA/DEGRE THE CONTROLLER IS LESS SENSITIVE LISTEN..LEARN..THINK..ENJOY YOURSELF 198
  • 199. EXAMPLE #1  Let’s consider a control system for a temperature in a process where the output of the controller is a pressure signal to the final element or valve.  The controller is used to control temperature within the range of 600F to 1000F.  The controller is adjusted so that the output signal varies from 3 psi (valve fully open) to 15 psi (valve fully closed) as the controlled temperature (measured) varies from 710F to 750F. Fpsi FF psipsip Kcp 0 00 /3 )7175( )315(         %10100. )60100( )7175( 00 00     FF FF PB LISTEN..LEARN..THINK..ENJOY YOURSELF 199
  • 200. EXAMPLE #2  Now, if we consider a PB of 75% for the same range of 600F to 1000F, what will be the Gain Kc?  From the PB formula, we find ΔT ( the change of the measured variable)  From the Gain formula: FFrangePBT 00 30)40.(75.0.  Fpsi F psipsi Kcp 0 0 /4.0 30 )315(    LISTEN..LEARN..THINK..ENJOY YOURSELF 200
  • 201. OFFSET OF PROPORTIONAL CONTROLLER  An important characteristic of a proportional controller is the OFFSET  In a proportional controller, there is always a residual error of the controlled variable.  It can be minimized by a large Kc which also reduce the PB  See figure 9-10 page 198 LISTEN..LEARN..THINK..ENJOY YOURSELF 201
  • 202. EXAMPLES OF USES OF A PROPORTIONAL CONTROLLER  Proportional controllers are mostly used for level control where variations of the controlled variables carry no economical and where others control modes can easily destabilize the loop  It is actually recommended for controlling the level of a surge tank when manipulating the flow of the feed to a critical downstream process. LISTEN..LEARN..THINK..ENJOY YOURSELF 202
  • 203. CHARACTERISTICS OF PROPORTIONAL CONTROLLER  Relationship between the output c(t) and error ε (t) is:  c(t) = Kc .ε(t) = Kc .ε(t)  Proportional Controller gives always an Off-Set, which is a difference between the controlled variable and set point.  A proportional controller will have the effect of reducing the rise time but never eliminate THE OFF SET  Increasing the gain or decreasing the PB will eliminate decrease off set but gives fluctuations 203
  • 204.  We can reduce the off set by increasing the gain BUT if the gain is too high, the controller become too sensitive and we will experience fluctuations and instability. GAIN AND OFF SET 204
  • 205. Selecting the Right Proportional band or PB That bit was the “hard part” to understand... But it is not so difficult to understand if we take a look at what it does in the actual application... 205
  • 206. PB too small C° (t) SV PB correct C° (t) SV PB too large C° (t) SV A Proportional Band that is too narrow causes hunting! The TC will than behave like an ON/OFF controller! A correctly sized P-Band results in an Overshoot, followed by an Undershoot and than Stabilization, with a small offset near the Set Point. With a (far) too large P-band the Setpoint temperature will never be reached! (As the heater capacity will be reduced too much). This will create a large offset from the Set Point! P-Action.The right setting of PB is very important ! 206
  • 207. Lets have a look now what will happen if we add the PI controller That explains the P-Action so far... The “Integral Action” 207
  • 208. Chapter 15 - Process Control Methods 208 The need of an Integral Action  Because of the introduction of offset in a control process, proportional control alone is often used in conjunction with Integral control.  Offset is the difference between set point and the measured value after corrective action has taken place
  • 209. Chapter 15 - Process Control Methods 209 Integral or Reset Action  Integral control is also referred to as reset control as the set point is continuously reset as long as an error is present  Integral adjustments that affect the output are labeled 3 ways:  Gain - expressed as a whole number  Reset - Expressed in repeats per minute  Integral Time - Expressed in minutes per reset
  • 210.  PI controller is a Proportional controller in which integral action is added. It has then two constants: A) PB B) Integral time An integral control will have the effect of eliminating the OFF SET , but it may make the response more oscillatory and needs longer to settle. PI OR PROPORTIONAL INTEGRAL CONTROLLER 210
  • 211.  The output of the controller is related to the error ε (t) by the relationship:  c(t) = Kc { 1+ (1/τi.s) }. ε(t); τi is the integral time.  Integral action eliminates the off set but the response becomes more oscillatory and needs longer to settle down. CHARACTERISTICS OF PI 211
  • 212.  As explained: The I-Action eliminates the Offset, but influences the whole process from the start ( fluctuations).  Making the Integral time shorter will give you more intense control with a quicker response to eliminate the offset. But a too short Integral time would result in “oscillation” (=hunting) !  Making the Integral time too long will reduce the possibility of hunting but will slow down your overall Process response. So the RIGHT setting is very important. The right Integral Time 212
  • 213. The setting of the right I-Time is very important ! 0 20 40 60 80 100 120 140 °C SP PV @ I=80s PV @ I=38s PV @ I=20s SV: 100o C The best way is to explain with a real control graph : A too long I-Time slows down the whole Process The RIGHT I-Time will enable the TC to reach the Setpoint quickly and to eliminate the Offset correctly. Making the I-Time too short creates a (large) overshoot. Also takes a long time to correct: Example of behaviour after a disturbance 213
  • 214. Lets have a look now at the PID controller Well.. That explains the “P+I Action”... The “Differential Action” 214
  • 215. Chapter 15 - Process Control Methods 215 Derivative Action  For rapid load changes, the derivative mode is typically used to prevent oscillation in a process system  The derivative mode responds to the rate of change of the error signal rather than its amplitude  Derivative mode is never used by itself, but in combination with other modes  Derivative action cannot remove offset
  • 216. PID or Proportional Integral Derivative Controller  PID controller is a PI controller in which the derivative action is added. It has then three constants:  A) PB  B) Integral time : τi  C) Derivative : τd  A derivative action will have the effect of increasing the stability of the system, reducing the overshoot, and improving the transient response. 216
  • 217.  The relationship between the output of the controler and the error ε(t) is c(t) = Kc { 1+ (1/τi.s) + τd.s }. ε(t); τi is the integral time and τd is the derivative time  All design specifications can be reached. CHARACTERISTICS OF PID 217
  • 218. A too long D-Time leads to “excessive” response! Than we will Over- and Undershoot the setpoint. (Far too long D-time will create oscillation, like ON/OFF Controller) A correctly sized D-Time results in a fast return to the Set Point. Could be followed by a small overshoot and than return rapidly to the Setpoint. With a too short D-time the Process will behave like a PI (only) controller, so will have a (too) slow response to disturbances. Note: With a setting of D-Time of 0 sec, we will have a PI Controller! The right setting of the D-Action is also very important ! o C o C o C The value of the D-Time is usually around ¼ of the I- Time. (For example: if the I-Time is 180sec., than the D- Time will be 45sec.) 218
  • 219. CONCLUSION: These 3 actions combined: * The “P-Action” * The “I-Action” * The “D-Action” = PID controller. That was a “tough part” to combine these 3 actions.... 219
  • 220. CL RESPONSE RISE TIME- First Time to reach set point OVERSHOOT- Highest value/set point value SETTLING TIME- Time to be inside 5% of set point OFF SET Kp Decrease Increase Small Change Decrease τi Decrease Increase Increase Eliminate τd Small Change Decrease Decrease Small Change EFFECTS OF PB, INTEGRAL TIME AND DERIVATIVE TIME ON THE PROCESS 220
  • 221. Chapter 15 - Process Control Methods 221 Control Mode Summary
  • 222. The following additional explanation can also help to understand the actions of the PID-controller: • The “P-Action” deals with the “present” Depending on the deviation from the Setpoint: more or less Output capacity will be given. • The “I-Action” deals with the “past” If we have been below setpoint: the Output will be increased. If we have been above setpoint: the Output will be decreased. • The “D-Action” deals with the “future” If the controlled variable is going down: the Output will be increased. If the controlled variable is going up: the Output will be decreased. This “combination”, of “Present + Past + Future”, makes it possible to control the application very well. 222
  • 223. TUNING THE CONTROLLER The task of controller tuning is usually left to an instrument technician with experience in the cause and effect of process reaction and controller adjustments. 223
  • 224. 224 Usefulness of PID Controls  Most useful when a mathematical model of the plant is not available  Many different PID tuning rules available  Sources  K. Ogata, Modern Control Engineering, Fourth Edition, Prentice Hall, 2002, Chapter 10  IEEE Control Systems Magazine, Feb. 2006, Special issue on PID control Proportional-integral-derivative (PID) control framework is a method to control uncertain systems 
  • 225. 225 Type A PID Control  Transfer function of PID controller  The three term control signal              sT sT K sE sU sG d i pPID 1 1        ssEKsE s KsEKsU dip  1
  • 227. Chapter 15 - Process Control Methods 227 Control Mode Summary
  • 228. Chapter 15 - Process Control Methods 228 Tuning the Controller  Fine-tuning is the process to optimize the controller operation by adjusting the following settings:  Gain setting (proportional mode)  Reset rate (integral mode)  Rate (derivative mode)  Three steps are taken when tuning a systems  Study the control loop  Obtain clearance for tuning procedures  Confirm the correction operation of the system components
  • 229. 229 PID Tuning  Controller tuning---the process of selecting the controller parameters to meet given performance specifications  PID tuning rules---selecting controller parameter values based on experimental step responses of the controlled plant  The first PID tuning rules proposed by Ziegler and Nichols in 1942  Other resource: K. Ogata, Modern Control Engineering, Prentice Hall, Fourth Edition, 2002, Chapter 10
  • 230. Chapter 15 - Process Control Methods 230 Trial-and-Error Tuning  Does not use mathematical methods, instead a chart recorder is used and several bump tests are made in the proportional and integral modes  Trial-and-error tuning is very time consuming and requires considerable experience on the part of the technician or operator
  • 231. 231 Ziegler-Nichols Tuning Methods Two formal procedures for tuning control loops: Step response of plant Continuous cycling method
  • 232. 232 PID Tuning---First Method Start with obtaining the step response
  • 233. 233 The S-shaped Step Response Parameters of the S-shaped step response
  • 234. 234 The S-Shaped Step Response  The S-shaped curve may be characterized by two parameters: delay time L and time constant T  The transfer function of such a plant may be approximated by a first-order system with a transport delay     1   Ts Ke sU sC Ls
  • 236. 236 Transfer Function of PID Controller Tuned Using the First Method
  • 237. 237 Ziegler-Nichols PID Tuning---Second Method Use the proportional controller to force sustained oscillations
  • 238. Chapter 15 - Process Control Methods 238 Continuous Cycling Method  The continuous cycling method analyzes the process by forcing the controlled variable to oscillate in even, continuous cycles  The time duration of one cycle is called an ultimate period. The proportional setting that causes the cycling is called the ultimate proportional value  These two values are then used in mathematical formulas to calculate the controller settings
  • 239.  For a set point change : set the proportional band to high value and reduce this value to the point where the system becomes unstable  The proportional band that required causing continuous oscillation is the ultimate value PBu.  The ultimate periodic time is Pu.  From these two values the optimum setting can be calculated. 239 ULTIMATE PROPORTIONAL BAND
  • 240. Chapter 15 - Process Control Methods 240 Continuous Cycle Calculations  Proportional only controller  Proportional Gain  Kc = Gu x 0.5 KC = proportional gain, Gu= ultimate gain  Proportional Band  PB = Pbu x 2 PB = proportional band PBu = ultimate proportional band
  • 241. The frequency of continuous oscillation is the cross over frequency ωco Pu= 2Π/ωco 241 Pu = Ultimate period of sustained cycle
  • 242. 242 Graphic method to Find Pu or Pcr Measure the period of sustained oscillation
  • 244. 244 Transfer Function of PID Controller Tuned Using the Second Method
  • 245. Chapter 15 - Process Control Methods 245 Ziegler-Nichols Reaction Curve Tuning Method  This method avoids the forced oscillations that are found in the continuous cycle tuning method  Cycling should be avoided if the process is hazardous or critical  This method uses step changes and the rate at which the process reacts is recorded  The graph produces three different values used in mathematical calculations to determine the proper controller settings
  • 246. Chapter 15 - Process Control Methods 246 Reaction Curve Tuning Formulas
  • 248. Final Control Elements These are some devices the controller operates:  Pneumatic valves,  solenoid valves,  rotary valves,  motors,  switches,  relays,  variable frequency drives.
  • 249.  Control valves are valves used to control conditions such as flow, pressure, temperature, and liquid level by fully or partially opening or closing in response to signals received from controllers that compare a "set-point" to a "process control variable" whose value is provided by sensors that monitor changes in such conditions 249 Definition
  • 250.  The opening or closing of control valves is usually done automatically by electrical, hydraulic or pneumatic actuators.  Positioners are used to control the opening or closing of the actuator based on electric, or pneumatic signals.  These control signals, traditionally based on 3-15psi (Pneumatic Valves), more common now are 4-20mA ( Electrical Valves) for industry, 0-10V for HVAC systems.  The introduction of "Smart" systems, HART, Fieldbus Foundation, and Profibus being the more common protocols. 250 Types of Control Valves
  • 251. 251 Actuator & positioner of a control valve
  • 252.  Control valves are used by automated systems to adjust flow rates.  The adjustments are dependent on the controlling system's setup. They can be automated based on sensor data and presets or manually controlled by an operator at a remote workstation.  For pneumatic valves, an actuator changes the current from the controller into pressure.  The relationship of current and pressure is calculated based on the process specifications and the equipment used.  This system will be designed by control vendors or in-house engineers in most cases. 252 ELECTRICAL OR PNEUMATIC CONTROL VALVES?
  • 253.  When an issue develops in a manufacturing process, the control valve will be designed to move into an open or closed position.  The safer option is dictated based on the process and the process stream involved. For this reason, valves that require energy to be open, are called:  Air or electricity to open  Fail-close  Reverse Acting The valves that require energy to be closed, are called:  Air or electricity to close  Fail-open  Direct Acting 253 Fail-Open and Fail-Close Valves
  • 254. Control valves Reverse acting: Fail-close or Air to Open Direct Acting: Fail-Open or Air to close 254
  • 255. Fail-open valves will open and continue to allow flow when the control valve loses energy in a failure situation.  For example, a valve might fail open to avoid allowing pressure of non-harmful gas to build up.  Cooling system control valves will usually fail open, since in most cases overcooling a system will not harm the equipment. When a failure causes energy to be lost, fail-close valves will close to keep streams contained until they can be checked and fixed.  Toxic streams will almost always fail closed to prevent contamination.  Reactor heating streams usually fail closed in order to avoid feeding energy to runaway reactions. 255 Examples for Fail –open & Fail-close Valves
  • 256. 256 Flow Characteristics of the Control Valve  The relationship between control valve capacity and valve stem travel is known as the Flow Characteristic of the Control Valve.  Trim design of the valve affects how the control valve capacity changes as the valve moves through its complete travel.  Because of the variation in trim design, many valves are not linear in nature. Valve trims are instead designed, or characterized, in order to meet the large variety of control application needs.  Many control loops have inherent non linearity's, which may be possible to compensate selecting the control valve trim.
  • 257.  The most common characteristics are shown in the next figure.  The percent of flow through the valve is plotted against valve stem position. The curves shown are typical of those available from valve manufacturers.  These curves are based on constant pressure drop across the valve and are called inherent flow characteristics. 257 Flow Characteristics
  • 259.  When valves are installed with pumps, piping and fittings, and other process equipment, the pressure drop across the valve will vary as the plug moves through its travel.  When the actual flow in a system is plotted against valve opening, the curve is called the Installed Flow Characteristic. 259 Installed Flow Characteristics
  • 260. In most applications, when the valve opens, and the resistance due to fluids flow decreases the pressure drop across the valve. This moves the inherent characteristic:  •A linear inherent curve will in general resemble a quick opening characteristic  •An equal percentage curve will in general resemble a linear curve 260 Installed flow Characteristics
  • 262. Valve Types Ball Valve Butterfly Valve Gate Valve Globe Valve Check Valve 262
  • 263. Ball Valve Sphere with a port in a housing, rotate to expose channel.  Applications: Flow control, pressure control, shutoff, corrosive fluids, liquids, gases, high temp.  Advantages – low pressure drop, low leakage, small, rapid opening  Disadvantages – seat can wear if used for throttling, quick open may cause hammer263
  • 265. Gate Valve Sliding disk, perpendicular to flow Applications: Stop valves, (not throttling), high pressure and temp, not for slurries, viscous fluids Advantages – low pressure drop when fully open, tight seal when closed, free of contamination buildup Disadvantages – vibration when partially open, slow response and large actuating force 265
  • 267. Butterfly Valve rotating disk on a shaft, in a housing Low pressure, large diameter lines where leakage is unimportant Advantages – low pressure drop, small and light weight Disadvantages – high leakage, high actuation forces so limited to low pressures 267
  • 269. Check Valves allows flow in only one direction Swing valve similar to butterfly except hinged along one edge rather than rotate about the diameter, used primarily for check valves. 269
  • 271. Rupture Disk (not a valve – ruptures at a set pressure) 271
  • 273. Servo & Regulator Problems  Two major problems could happen in any plant:  1) REGULATOR: The most common situation is when a disturbance appears in the plant. The controller will make correction to bring the controlled variable to set point.  2) SERVO: Very often, operators in the control room will have to change the set point of some controlled variable. How the controller will bring the controlled variable to the new set point.  Both situations will be investigated in the labs 5 & 6. 273
  • 274. LABS #5 & 6 Controlling pressure in a tank using digital P, PI and PID digital controllers  Tuning of a P, PI and PID controller to maintain the pressure in a water tank constant during servo or regulator situations:  Lab #5: The main objective of the lab is to analyze and compare the graphs of the P,PI and PID controllers.  Lab #6: Study constants of controllers to avoid instability in the plant. 274
  • 275. L.O #3 Explain feedback control and the dynamic behavior of this controller. 275
  • 276. 276 Driving your car Sense Vehicle Speed Compute Control “Law” Actuate Gas Pedal  Goals  Stability: system maintains desired operating point (hold steady speed)  Performance: system responds rapidly to changes (accelerate to 65 mph)  Robustness: system tolerates perturbations in dynamics (mass, drag, etc)
  • 277. Basic Feed back Control House is too cold Furnace Thermostat Controller recognized the house is too cold sends signal to the furnace to turn on and heat the house furnace turns on heats the housenatural gas house temperature measured is temperature below setpoint? Set-point = 200C Controlled variable: temperature (desired output) Input variable: temperature (measured by thermometer in thermostat) Set-point: user-defined desired setting (temperature) Manipulated variable: natural gas valve to furnace (subject to control) 277
  • 278.  Output of the system y(t) is fed back to the set-pint r(t) through measurement of a sensor  Controller senses the difference between the set point and the output and determines the error ε(t)  Controller changes the manipulated variable u to Process to eliminate the error. Feedback Control is a Single Loop 278
  • 279. Example #2 for Feedback Control Examples:  Room temperature control  Automatic cruise control  Steering an automobile  Supply and demand of chemical engineers Controller Transmitter Set point stream Temp sensor Heat loss condensate
  • 280. Feedback Control-block diagram Terminology:  Set point  Manipulated variable (MV)  Controlled variable (CV)  Disturbance or load (DV)  Process  controller Σ Controller process Sensor + transmitter + -Set point Measured value error Manipulated variable Controlled variable disturbance
  • 281. 281 THE ELEMENTS OF A FFEDBACK PROCESS CONTROL SYSTEM  LEVEL6:
  • 282. 282 A modern Feedback Control System
  • 283.  Feedback control is not predictive: Controlled variable has to be affected before controller takes action  Requires management or operators to change set points to optimize system: - Changes can bring instability into system - Optimization of many input and output variables almost impossible Limitations of Feedback Control 283
  • 284. Apply the principles of feed-forward and show how this type of control can be applied. L.O #4 284
  • 285. 285 FEED-FORWARD CONTROL  The feedback control can never achieve perfect control of a chemical process  Why?  Because the feedback control reacts only when it has detected a deviation of the CONTROLLED VARIABLE from the desired set point.  However, the feed-forward control measures the disturbance directly and takes control action to eliminate its impact on the CONTROLLED VARIABLE  Therefore  Feed-forward controllers have the theoretical potential to achieve perfect control
  • 286. Feedforward Control Window is open Furnace Feedforward Recognize window is open and house will get cold in the future: Someone reacts and changes controller setpoint to turn on the furnace preemptively. furnace turns on heats the housenatural gas house temperature is currently OK turn on furnace Decrease setpoint to turn furnace on Pre-emptive move to prevent house from getting cold 286
  • 287.  Feed-forward control avoids slowness of feedback control  Disturbances are measured and accounted for before they have time to affect the system  In the house example, a feed-forward system measured the fact that the window is opened  As a result, automatically turn on the heater before the house can get too cold  Difficulty with feed-forward control: effects of disturbances must be perfectly predicted  There must not be any surprise effects of disturbances Feed-forward is a single loop 287
  • 288. 288 THE FEEDBACK AND FEED FORWARD CONTROL Both control involve a single loop with : One measurement  One manipulated variable. However:  In a feedback control, we measure the controlled variable  In a feed-forward control, we measure the disturbance
  • 289. L.O #5 Describe how the principles of cascade control, ratio, the selective control and split - range control are used in processes control. 289
  • 291. 291 CONTROL SYSTEMS WITH MULTIPLE LOOPS  Other simples configurations which may use: * More than one measurable variable and one manipulated variable * One measurable variable and more than one manipulated variable
  • 292. CASCADE CONTROL In this configuration, we have :  More than one measurement  One manipulated variable 292
  • 293. 293 CASCADE CONTROL LOOPS  Cascade control is two control loops using two different measurements :  1) One measurement for the controlled variable  2) One measurement for the disturbance  3) One manipulated variable  The loop that measures the controlled variable is the dominant or primary or master control loop  The loop that measures the disturbance is the secondary or slave loop
  • 294. CASCADE FOR HEAT EXCHANGER 294
  • 295. Cascade for jacketed CSTR TRC FC Tc T, Ca W Set Point Wc 2A  B
  • 296. Ratio Control is a special type of feed- forward control  Two disturbances are measured and held in a constant ratio  It is mostly used to control the ratio of flow-rates of two streams RATIO CONTROL : 296
  • 297. EX: RATIO CONTROLLER IN A BURNER 297
  • 299. We measure both flow-rates and take their ratio  The ratio is compared to the desired ratio  The error is sent to the ratio controller Strategy of ratio control: 299
  • 300. 300 SELECTIVE CONTROL  In this kind of control, we  One manipulated variable  Several controlled output  Since with one manipulated variable, we can control only one output, The selective control systems transfer control action from one controlled output to another according to need  we will discuss * Override Control * Auctioneering control
  • 301. 301 SAFETY OF EQUIPMENTS: OVERRIDE CONTROL  During the normal operation of a plant or during its startup or shutdown , it is possible that a dangerous situation may arise and may lead to destruction of equipment.  In such cases, it is necessary to change from production control to safety control in order to prevent a process variable from exceeding an allowable upper or lower limit  This can be achieved by the use of switches: The switch is used to select between the production controller and the safety controller.  The HSS ( high selector switch) is used whenever a variable should not exceed an upper limit  The LSS ( low selector switch) is used whenever a variable should not exceed a lower limit.
  • 302. EXAMPLE OF OVERRIDE The steam header must be maintained above a minimum pressure (PC FOR SAFETY). Steam from the header is used to heat water in a heat exchanger. The temperature of the hot water is controlled by TIC-101 (PRODUCTION CONTROLLER) SAFETY FIRST: t is more important that the header pressure be above its minimum than that the water temperature be at its set-point. 302
  • 303. 303
  • 304. 304 SAFETY OF EQUIPMENTS: AUCTIONEERING CONTROL In this control system, among several similar measurements, the one with the highest value will feed the controller  This is a selective control between several measured variables.
  • 306.  The split range control has  One measurement only ( Controlled variable)  More than one manipulated variable ( control valve)  If the valves are pneumatic: The instrumentation pressure range ( 3-15 psia) is divided.  If the valves are electrical: The instrumentation current ( 4-20 mA) is divided.  Ex: If we have two pneumatic valves:  Valve #1 will operate between 3- 9 psia and Valve #2 will operate between 9 - 15 psia. SPLIT RANGE CONTROL 306
  • 307. Split Range Flow Control  In certain applications, a single flow control loop cannot provide accurate flow metering over the full range of operation.  Split range flow control uses two flow controllers (one with a small control valve and one with a large control valve) in parallel.  At low flow rates, the large valve is closed and the small valve provides accurate flow control.  At large flow rates, both valve are open. 307
  • 308. EX: Split Range Temperature Control TT Cooling Water Steam Split-Range Temperature Controller TT TC RSP 308
  • 309. L.O #6: DIGITAL CONTROL SYSTEM THE CONTROLLER IS A SOFTWARE IN COMPUTER 309
  • 310. DIGITAL CONTROLLER  Digital control is a branch of control theory that uses digital computers to act as system controllers.  Depending on the requirements, a digital control system can take the form of a microcontroller to an ASIC to a standard desktop computer.  Since a digital computer is a discrete system, the Laplace 310
  • 311. PLC: Programmable Logic Controller CPU System User Ladder Diagram Working memory registers Input Flag Output Input Module Output Module 311
  • 312. DIGITAL CONTROLLER Typically, a digital controller requires:  A/D conversion to convert analog inputs to machine readable (digital) format  D/A conversion to convert digital outputs to a form that can be input to a plant (analog)  A program that relates the outputs to the inputs 312
  • 313. 313 Block diagram of a digital control system control: difference equations D/A and hold sensor 1 r(t) u(kT) u(t)e(kT) + - r(kT) plant G(s) y(t) clock A/D T T y(kT) digital controller voltage → bit bit → voltage
  • 314. An Large Size PLC  The main module measures 19” x 20” x 14.5”.  have upto 10,000 I/O points  supports all functions  expansion slots to accommodate PC and other communication devices. Allen-Bradley PLC-3 314
  • 315. A Small Size PLC  Measures 4.72”x 3.15” x 1.57”.  32 I/O points  Standard RS 232 serial communication port Allen-Bradley MicroLogix 1000 315
  • 316. PLC ARCHITECTURE Programmable controllers replace most of the relay panel wiring by software programming. Processor I/O Modules Memory Power Supply Program Loader Printer Cassette Loader EPROM Loader Switches Machines Peripherals External Devices PC A typical PLC316
  • 317. PLC COMPONENTS 1. Processor Microprocessor based, may allow arithmetic operations, logic operators, block memory moves, computer interface, local area network, functions, etc. 2. Memory Measured in words. ROM (Read Only Memory), RAM (Random Access Memory), PROM (Programmable Read Only Memory), EEPROM (Electric Erasable Programmable ROM), EPROM (Erasable Programmable Read Only Memory), EAPROM (Electronically Alterable Programmable Read Only Memory), and Bubble Memory. 317
  • 318. PLC COMPONENTS3. I/O Modular plug-in periphery AC voltage input and output, DC voltage input and output, Low level analog input, High level analog input and output, Special purpose modules, e.g., high speed timers, Stepping motor controllers, etc. PID, Motion 4. Power supply AC power 5. Peripheral hand-held programmer (HHP) CRT programmer operator console printer simulator EPROM loader graphics processor network communication interface modular PC 318
  • 320. Distributed Control Systems  Collection of hardware and instrumentation necessary for implementing control systems  Provide the infrastructure (platform) for implementing advanced control algorithms
  • 321. History of Control Hardware  Pneumatic Implementation:  Transmission: the signals transmitted pneumatically are slow responding and susceptible to interference.  Calculation: Mechanical computation devices must be relatively simple and tend to wear out quickly.
  • 322. History (cont.)  Electron analog implementation:  Transmission: analog signals are susceptible to noise, and signal quality degrades over long transmission line.  Calculation: the type of computations possible with electronic analog devices is still limited.
  • 323. History (cont.)  Digital Implementation:  Transmission: Digital signals are far less sensitive to noise.  Calculation: The computational devices are digital computers.
  • 324. Advantages of Digital System  Digital computers are more flexible because they are programmable and no limitation to the complexity of the computations it can carry out.  Digital systems are more precise.  Digital system cost less to install and maintain  Digital data in electronic files can be printed out, displayed on color terminals, stored in highly compressed form.
  • 325. Computer Control Networks 1. PC Control:  Good for small processes such as laboratory prototype or pilot plants, where the number of control loops is relatively small PROCESS Final control element Data acquisition Main Computer Display
  • 326. Computer Control Networks 2. Programmable Logic Controllers:  specialized for non-continuous systems such as batch processes.  It can be used when interlocks are required; e.g., a flow control loop cannot be actuated unless a pump has been turned on.  During startup or shutdown of continuous processes.
  • 327. DCS: Computer Control Networks Operator Control Panel Main Control Computer Operator Control Panel Archival Data Storage Supervisory (host) Computer PROCESS Local Computer Local Computer Local Computer Local Display Local Display Data highway To other Processes To other Processes Local data acquisition and control computers 3. DCS •Most comprehensive
  • 328. DCS Elements-1  Local Control Unit: This unit can handle 8 to 16 individual PID loops.  Data Acquisition Unit: Digital (discrete) and analog I/O can be handle.  Batch Sequencing Unit: This unit controls a timing counters, arbitrary function generators, and internal logic.  Local Display: This device provides analog display stations, and video display for readout.  Bulk Memory Unit: This unit is used to store and recall process data.
  • 329. DCS Elements-2  General Purpose Computer : This unit is programmed by a customer or third party to perform optimization, advance control, expert system, etc  Central Operator Display: This unit typically contain several consoles for operator communication with the system, and multiple video color graphics display units  Data Highway : A serial digital data transmission link connecting all other components in the system. It allow for redundant data highway to reduce the risk of data loss  Local area Network (LAN)
  • 330. Advantages of DCS  Access a large amount of current information from the data highway.  Monitoring trends of past process conditions.  Readily install new on-line measurements together with local computers.  Alternate quickly among standard control strategies and readjust controller parameters in software.  A sight full engineer can use the flexibility of the framework to implement his latest controller design ideas on the host computer.
  • 331. Modes of Computer control signals from digital computer Local PID controller Supervisory Control mode Direct digital Control mode valve setting from computer Flow measurement to computer 1.Manual 2.Automatic • PID with local set point 3.Supervisory • PID with remote set point (supervisory) 4.Advanced
  • 332. Additional Advantage Digital DCS systems are more flexible. Control algorithms can be changed and control configuration can be modified without having rewiring the system.
  • 333. Categories of process information ExampleType Relay, Switch Solenoid valve Motor drive 1. Digital Alphanumerical displays2. Generalized digital Turbine flow meter Stepping motor 3. Pulse Thermocouple or strain gauge (mill volt) Process instrumentation (4-20 am) Other sensors (0-5 Volt) 4. Analog
  • 334. A/D and D/A converters or transducers are the Interface between digital computer and analog instruments (A/D) Transducers convert analog signals to digital signals. (Sensor Computer) (D/A) Transducers convert digital signals to analog signals. (Computer Valve)
  • 335. Data resolution due to digitization  Accuracy depends on resolution.  Resolution depends on number of bits: Resolution = signal range × 1/(2m -1) m = number of bits used by the digitizer (A/D) to represent the analog data
  • 336. Data Resolution  Signal = 0 - 1 Volt, 3 bit digitizer: Analog range covered Analog equivalent Digital Equivalent Binary representation 0 to 1/14 1/14 to 3/14 3/14 to 5/14 5/14 to 7/14 7/14 to 9/14 9/14 to 11/14 11/14 to 13/14 13/14 to 14/14 0 1/7 2/7 3/7 4/7 5/7 6/7 1 0 1 2 3 4 5 6 7 0 0 0 0 0 1 0 1 0 0 1 1 1 0 0 1 0 1 1 1 0 1 1 1
  • 337. Data Resolution 0 1/7 2/7 3/7 4/7 5/7 6/7 1 0 1 2 3 4 5 6 7 Analog data Digitaldata
  • 338. Utilization of DCS  DCS vendor job:  installation  Control Engineer Job:  Configuration  Built-in PID control:  How to Tune the PID control?
  • 339. Utilization of DCS  Implementation of advanced control:  Developed software for control algorithms, DMC, Aspen, etc.  Control-oriented programming language supplied by the DCS vendors.  Self-developed programs using high-level programming languages (Fortran, C++)
  • 341. DCS Vendors  Honeywell  Fisher-Rosemont  Baily  Foxboro  Yokogawa  Siemen
  • 343.  Process flow diagrams (PFDs) are used in chemical and process engineering. These diagrams show the flow of chemicals and the equipment involved in the process.  Generally, a Process Flow Diagram shows only the major equipment and doesn't show details. PFDs are used for visitor information and new employee training. DEFINITION OF PFD 343
  • 344.  A Process and Instrument Drawing (P&ID) includes more details than a PFD. It includes major and minor flows, control loops and instrumentation.  P&ID is sometimes referred to as a Piping and Instrumentation Drawing. These diagrams are also called flow-sheets.  P&IDs are used by process technicians and instrument and electrical, mechanical, safety, and engineering personnel. DEFINITION OF PI&D 344
  • 345. PFD & PI&D In both diagrams arrows show the flow of material and symbols show tanks, valves, and other equipment. The symbols used vary somewhat from organization to organization. So you may see several different symbols that all represent a motor. 345
  • 348. P& ID SYMBOLS ISA Symbols and Loop Diagrams 348
  • 349.  Piping and Instrumentation Diagrams or simply P&IDs are the “schematics” used in the field of instrumentation and control (Automation)  The P&ID is used to by field techs, engineers, and operators to better understand the process and how the instrumentation is inter connected. INTRODUCTION 349
  • 350.  Most industries have standardized the symbols according to the ISA Standard S5.1 Instrumentation Symbol Specification. Piping & Instrumentation Drawing (original) Process & Instrumentation Diagram (also used) Process Flow Diagram – PFD (simplified version of the P&ID) ISA Standard S5.1 Instrumentation Symbol Specification 350
  • 351. Building the P&ID using examples like pressure or temperature control. L.O #1 351
  • 352. 352
  • 353. 353
  • 354. From the typical example, define Tag Numbers and Tag Descriptors. L.O #2 354
  • 355. 355
  • 356. 356
  • 357. Learn the ISA S5.1 Identification Letters like (TI, PC, LR, TRC, …) L.O #3 357
  • 358. 358
  • 359. Class work: identify the following 359
  • 361. 361
  • 362. Learn about Shared Displays/Shared Control and draw a summary of instrument type & location L.O #5 362
  • 363. 363
  • 364. 364
  • 365. PIPING & CONNECTIONS SYMBOLS L.O #6 : Identify Piping, Connection and valves Symbols 365
  • 366. 366
  • 368. 368
  • 369. Different industrial examples will be studied. L.O #7 369
  • 370. 370
  • 373. PFD: PROCESS FLOW DIAGRAM 373
  • 374. 374
  • 376. Other Symbols for PFD Table 1.2 : Conventions Used for Identifying Process Equipment Process Equipment General Format XX-YZZ A/B XX are the identification letters for the equipment classification C - Compressor or Turbine E - Heat Exchanger H - Fired Heater P - Pump R - Reactor T - Tower TK - Storage Tank V - Vessel Y designates an area within the plant ZZ are the number designation for each item in an equipment class A/B identifies parallel units or backup units not shown on a PFD Supplemental Information Additional description of equipment given on top of PFD 376
  • 377. Equipment Numbering  XX-YZZ A/B/…  XX represents a 1- or 2-letter designation for the equipment (P = pump)  Y is the 1 or 2 digit unit number (1-99)  ZZ designates the equipment number for the unit (1-99)  A/B/… represents the presence of spare equipment377
  • 378. Examples T-905 is the 5th tower in unit nine hundred P-301 A/B is the 1st Pump in unit three hundred plus a spare 378
  • 379. Equipment Information  Equipment are identified by number and a label (name) positioned above the equipment on the PFD  Basic data such as size and key data are included in a separate table (Equipment Summary Table). 379
  • 381. Process and Utility Streams 381
  • 382. Number of streams and information Stream Number 1 2 3 4 5 6 7 8 9 10 Temperature (°C) 25 59 25 225 41 600 41 38 654 90 Pressure (bar) 1.90 25.8 25.5 25.2 25.5 25.0 25.5 23.9 24.0 2.6 Vapor Fraction 0.0 0.0 1.00 1.0 1.0 1.0 1.0 1.0 1.0 0.0 Mass Flow (tonne/h) 10.0 13.3 0.82 20.5 6.41 20.5 0.36 9.2 20.9 11.6 Mole Flow (kmol/h) 108.7 144.2 301.0 1204.4 758.8 1204.4 42.6 1100.8 1247.0 142.2 Component Mole Flow (kmol/h) Hydrogen 0.0 0.0 286.0 735.4 449.4 735.4 25.2 651.9 652.6 0.02 Methane 0.0 0.0 15.0 317.3 302.2 317.3 16.95 438.3 442.3 0.88 Benzene 0.0 1.0 0.0 7.6 6.6 7.6 0.37 9.55 116.0 106.3 Toluene 108.7 143.2 0.0 144.0 0.7 144.0 0.04 1.05 36.0 35.0 A Portion of Table 1.5 382
  • 383. Class work: identify all the information 383
  • 384. CASE STUDY FOR THE COURSE 384