SlideShare una empresa de Scribd logo
1 de 11
A SIMPLE MODEL OF THE LIVER MICROCIRCULATION

1. INTRODUCTION:

The liver is the largest internal organ, and the body’s second largest, after the skin. It
has four lobes and is surrounded by a capsule of fibrous connective tissue called
Glisson’s capsule. Glisson’s capsule in turn is covered by the visceral peritoneum (tunica
serosa), except where the liver adheres directly to the abdominal wall or other organs.
The parenchyma of the liver is divided into lobules, which are incompletely partitioned
by septa from Glisson’s capsule.


                                     Figure-1: Liver


                             Figure-2: Classic lobule of liver


                                                                              Page 5 of 43
Figure-3: Classic lobule of liver

The blood vessels supplying the liver (portal vein and hepatic artery) enter at the hilum
(or porta hepatis), from which the common bile duct (carrying bile secreted by the
liver) and lymphatic vessels also leave. Within the liver sinusoids, the oxygen-poor but
nutrient rich blood from the portal vein mixes with the oxygenated blood from the
hepatic artery. From the sinusoids, the blood enters a system of veins which converge
to form the hepatic veins. The hepatic veins follow a course independent of the portal
vessels and enter the inferior vena cava.

The classic liver lobule is considered to be the functional unit of the organ. Each is a
roughly hexagonally shaped, three dimensional unit, demarcated by connective tissue
and constructed of the parenchymal cells of the liver, hepatocytes, in large numbers.
On the picture to the right we can see the diagrammatic representation of a classic
liver lobule, showing the organization of branches of the portal vein and hepatic artery,
along with bile duct branches at the periphery of the lobule (in portal triads), and the
central vein in the center of the lobule.

As mentioned above, the liver receives a dual blood supply. The hepatic portal vein
provides about 60% of the incoming blood, the rest comes from the hepatic artery. The


                                                                             Page 6 of 43
blood from the portal vein has already supplied the small intestine, pancreas and
spleen, and is largely deoxygenated. It contains nutrients and noxious materials
absorbed in the intestine, blood cells and their breakdown products from the spleen,
and endocrine secretions from the pancreas. The blood from the hepatic artery supplies
the liver with oxygen. Because the blood from the two sources intermingles as it
perfuses the liver cells, these cells must carry out their many activities under low
oxygen conditions that most cells could not tolerate.

In the process of transplanting a new liver in a patient, it is possible that the liver is
smaller than the correct size and it takes some time for the new liver to grow and
match the correct size in the new body. During the growth process, hypertensions in
hepatic portal vein can occur due to the micro-vascular changes and the high rate of
perfusion. Allowing some extra blood to bypass, a shunt may be inserted between the
the portal veins and hepatic veins. Knowledge about the resistance of the flow through
the liver, the relation between the pressure drop across the liver and the blood flow, is
highly important for a proper shunt design.

In this simple model, we present the pressure distribution and velocity profle across the
hepatic lobules, which are the basic morph functional units of the liver. The lobule has
approximately a hexagonal shape and the diameter of each lobule is about 1 mm (see
Figure 2 and 3). We small focus on one lobule and calculate the pressure distribution
and velocity profle across one lobule.

2. MATHEMATICAL MODEL OF THE fzOW IN THE LIVER LOBULE:

We consider the liver as a two dimensional porous media and therefore we apply the
assumptions of porous media in our modelling.

2.1   Flow in porous medium:

We model the liver as a porous medium and consider it as a solid that has many
interconnected pores. Due to the complexity of the geometry, solution of the Navier-
Stocks equation in each individual pore, even in the linear form is complicated. In this
case one good approach is to use the average velocity across the liver. Using the
average velocity is valid as long as:

                                            S TA  S IP
Wmere,
S TA  Special scales of my whole area and
S IP  Special scales of individual pores


                                                                              Page 7 of 43
Also we consider the medium to be homogenous (characteristics of the medium is the
same everywhere) and isotropic (no direction preference). In addition, we consider the
porosity ɸ of the porous media as:
                                           V
                                        P
                                           VT
Wmere,
V P =Volume of pores,
VT = Total volume of tme area

We consider the blood to be a Newtonian fluid and therefore the flow in the porous
media is governed by Darcy equation:
                               k
                          q   p                 ( 1)
                               
Where
   q: volume flux per unit area of the medium. q is called the apparent velocity and
      is not the actual velocity. The actual average velocity within the pores is-
                                              u  q

                                             q  L
                                                 T
      k: permeability of the medium. Measures how strong are the solid against the
       flow. The larger the permeability constant, the lower is the resistance of the
       medium against the flow. k depends on porosity (ɸ) and the geometry of the
       pores (tortousity and the degree of interconnection). It is important to mention
       that k does not depend on the theology of the fluid. k   L2
      μ: dynamical viscosity
      p: fluid pressure

For an incompressible fluid owing through an incompressible solid, the coninuitity
equation is
                                     .q  0
Taking the divergence of the Darcy equation we get
                                         2.p  0
Which means that the velocity field of an incompressible fluid is harmonic.

2.2    Modeling assumptions:

We use a simple model as in Figure 4 with the following assumptions:
   The lobules are treated as identical regular hexagonal prisms arranged in a
     lattice.
   The diameter of the portal tracts and centrilobular veins are much smaller than
     the axial length of the lobules.

                                                                              Page 8 of 43
   The axial length of the lobules is long compared to the length of an edge of the
       hexagon.
      End effects are neglected and the flow is treated as two-dimensional.


                         Figure-4: Simple model for liver lobule

2.3    Problem Formulation:

Our goal is to find the pressure distribution and velocity profile at every point in the
liver lobule. We assume that:

      The lobule is a two dimensional porous media
      Portal tracts are modeled as point sources
      Centrilobular veins are modeled as point sink

Using the polar coordinates, the apparent velocity q  q r , q  of a two dimensional
source/sink point centered in the origin satisfies the followings:

      If we denote the total flux through any circle centered in origin as Q and the
       distance from the source/sink point as r, then
                                        0

                                         rq d  2rq
                                       2
                                            r            r   Q

                                                      Q
                                                q
                                                     2r
      Due to symmetry                               q  0


mere for sources we have Q > 0 and for sinks Q < 0. Using Darcy law [equation (1)],
we can obtain the pressure distribution as
                                         Q
                                    p      log r  c
                                         2k


                                                                            Page 9 of 43
Using the above scheme, the mathematical problem can be formulated as


p.n  0 along the hexagon sides


Where Q  and Q  denote the intensity of the sources and sinks, respectively and we
assume Q   0 and Q   0 . Moreover, in the above expressions  is the Dirac function
and n denotes the unit vector normal to the hexagon side.

2.4     Pressure distribution:

To enforce p.n  0 , a good technique is to add infinite sources and sinks to our model.
In a lattice of hexagons there are twice as many sources (angles of the hexagons) than
sinks (centers of the hexagons). In order for the mass to be conserved the intensity of
a sink has to be twice that of a source.

The solution for the pressure in a single point (x,y) within the hexagon can then be
expressed as:

                    2N Q                                              Q                                   
                      
                                                                     2N    
p( x, y )  lim   
            N   
                              log
                                    x  x 
                                            2
                                                   
                                                  y  y i   
                                                              2   
                                                                           log
                                                                                   x  x 
                                                                                          2
                                                                                                
                                                                                                y  y   
                                                                                                          2
                                                                                                              
                          2k                                     j 1 2k                                 
                                           i                                             j            j
                    i 1                                                                                      


Where N  denotes the number of sinks (and N   2 N  ), xi , y i  denotes the position
of the i th source and xi , y i  the position of the j th sink.


2.4.1 Dimenii nzess variabzes:
                                                     x
                                                x* 
                                                     L
                                                     q
                                                q* 
                                                     U
                                                         p
                                                 p* 
                                                        UL
                                                         k


                                                                                           Page 10 of 43
Where L is the length of the side of the lobule, U is the characteristic velocity of the
blood, and the pressure scaling is derived from the Darcy equation. Also, we assume
that the flux per unit length Q  coming out of portal tracts can be written as:


                                                      Q   Ud


Where d is the diameter of a portal tract.

2.5       Pressure distribution in the dimensionless form reads:

                      2N d                                                                                                             
                                                                               


                                log   x              y                        log   x                 y                
                                                                              2N
                                                                                   d
p ( x , y )  lim                             * 2              * 2
                                                                                                                                      
                                                                                                              2                     2
 *    *    *
                                   
                                            *
                                                x            *
                                                                  y                     
                                                                                                  *
                                                                                                       x*            *
                                                                                                                            y *
              N                                                        j 1 2 L                                                  
                                                 i                 i                                     j                     j
                      i 1 2 L                                                                                                          


q *  * p *


Now, using the following dimensional values extracted from the lecture notes, we can
compute the velocity profile and pressure distribution.

                                                        L  500m
                                                        d  50m
                                                        U  4  10 3 ms 1

2.6 Simulation of the pressure distribution and velocity profie:

2.6.1 Description of the algorithm:

     1. We take a rectangular domain with area 2 x n 2 y n  where x n and y n denote the
          number of points in the positive x and y axis, respectively.

     2. We generate the sources and sinks using 4 vectors as follows:

                                                      v1  1,0
                                            1 3 
                                       v2   ,   
                                            2 2 
                                            3 3 
                                       w1   ,   
                                            2 2 
                                              3     3
                                       w2   ,     
                                              2    2 
The sinks and sources are the linear combination of these vectors.


                                                                                                                  Page 11 of 43
3. Since the above source/sink generation won't end up in a symmetric domain, we
        choose a circular symmetric domain to calculate the pressure distribution
        formulated in equation (2), for example a good symmetric domain could be:

                                                 2
                                      xn  y n 
                                       2     2
                                                   x n if x n  y n
                                                 3
                                                 2
                                      x n  y n  y n if x n  y n
                                        2     2

                                                 3

     4. Choosing the dimensional values as L  500m , d  50m and U  4  10 3 ms 1 ,
        we will calculate the pressure distribution and velocity profile using the
        dimensionless equations (2) and (3) in one hexagonal lobule.

     5. Finally, we sketch the velocity profile and pressure distribution in one hexagonal
        lobule.


                              Figure-5: Point generator vectors


FEW PAGES ARE MISSING DUE TO @COPY RIGHT OF THIS ARTICLE

                                                                             Page 12 of 43
4. RESULTS:

For the simulation part, we consider x n  15, y n  15 , and the grid size to be h  0.05 .


                   Figure-5: Tme Source/sink distribution in liver lobules


                  Figure-6: Pressure distribution in one mexagonal lobule


                                                                                   Page 16 of 43
Figure-7: Pressure distribution in one mexagonal lobule

Figure 6 and 7 show the pressure distribution within a hexagonal liver lobule. It can be
immediately noticed that the pressure in the portal tracts (blood entering points located
at each of the vertices of the hexagonal lobule) and centrilobular veins (blood exiting
points located in the center of the cross-section) are larger than the other areas. As a
conclusion, the deformation of tissues which is the result of high pressure in the liver
may occur in these entering/exiting areas.


                    Figure-8: Velocity distribution in the liver lobule


                                                                            Page 17 of 43
Figure 8 illustrates the velocity distribution in the liver lobule. It can be observed that
p.n  0 is satisfied in all the sections of the hexagon, where n is the outward normal
to each side of hexagon.

5. Conclusions

Although our model is simple, it gives useful information about the pressure distribution
and velocity pofile in a cross-section of the liver lobule. Note that considering the blood
archeology, one can give a slightly more accurate distribution, especially considering
the shear-thinning behavior of blood. This modification is useful in the implementation
of a small liver and the shunt design.


                                                                              Page 18 of 43

Más contenido relacionado

La actualidad más candente

Anatomy physiology and embryology of urinary tract
Anatomy physiology and embryology of urinary tractAnatomy physiology and embryology of urinary tract
Anatomy physiology and embryology of urinary tractMohammad Ihmeidan
 
Ischio rectal fossa
Ischio rectal fossaIschio rectal fossa
Ischio rectal fossaanatomysrs
 
Extrahepatic biliary atresia
Extrahepatic biliary atresiaExtrahepatic biliary atresia
Extrahepatic biliary atresiaAnupshrestha27
 
Embryology of Digestive system
Embryology of Digestive systemEmbryology of Digestive system
Embryology of Digestive systemprofgoodnewszion
 
Gastroesophageal Reflux in Preterm Neonate
Gastroesophageal Reflux in Preterm NeonateGastroesophageal Reflux in Preterm Neonate
Gastroesophageal Reflux in Preterm NeonateTauhid Bhuiyan
 
Portal hypertension in paediatrics
Portal hypertension in paediatricsPortal hypertension in paediatrics
Portal hypertension in paediatricsUday Sankar Reddy
 
Hematemesis in children-Beyond Infancy
Hematemesis in children-Beyond InfancyHematemesis in children-Beyond Infancy
Hematemesis in children-Beyond Infancydivyaanair
 
Portal vein &amp; portocaval anastomosis
Portal vein &amp; portocaval anastomosis Portal vein &amp; portocaval anastomosis
Portal vein &amp; portocaval anastomosis Dr Mohammad Amaan
 
Tuning fork test
Tuning fork testTuning fork test
Tuning fork testRazal M
 
Adrenal gland endocrine-
Adrenal gland endocrine-Adrenal gland endocrine-
Adrenal gland endocrine-Marami Mustapa
 
Motor system pathways for students
Motor system pathways for studentsMotor system pathways for students
Motor system pathways for studentsvajira54
 
Development of midgut and pancreas
Development of midgut  and pancreas Development of midgut  and pancreas
Development of midgut and pancreas Sahar Hafeez
 
The Sympathetic Nervous System
The Sympathetic Nervous SystemThe Sympathetic Nervous System
The Sympathetic Nervous SystemAashiSingla2
 
Congenital anomalies of respiratory system A Radiological approach
Congenital anomalies of respiratory system A Radiological approachCongenital anomalies of respiratory system A Radiological approach
Congenital anomalies of respiratory system A Radiological approachArif S
 
Short stature in children 2020
Short stature in children  2020Short stature in children  2020
Short stature in children 2020Imran Iqbal
 

La actualidad más candente (20)

Anatomy physiology and embryology of urinary tract
Anatomy physiology and embryology of urinary tractAnatomy physiology and embryology of urinary tract
Anatomy physiology and embryology of urinary tract
 
Ischio rectal fossa
Ischio rectal fossaIschio rectal fossa
Ischio rectal fossa
 
Pituitary gland anatomy
Pituitary gland anatomyPituitary gland anatomy
Pituitary gland anatomy
 
Extrahepatic biliary atresia
Extrahepatic biliary atresiaExtrahepatic biliary atresia
Extrahepatic biliary atresia
 
Embryology of Digestive system
Embryology of Digestive systemEmbryology of Digestive system
Embryology of Digestive system
 
Gastroesophageal Reflux in Preterm Neonate
Gastroesophageal Reflux in Preterm NeonateGastroesophageal Reflux in Preterm Neonate
Gastroesophageal Reflux in Preterm Neonate
 
Portal hypertension in paediatrics
Portal hypertension in paediatricsPortal hypertension in paediatrics
Portal hypertension in paediatrics
 
Duodenum & pancreas
Duodenum & pancreas   Duodenum & pancreas
Duodenum & pancreas
 
Anatomy of limbic system
Anatomy of  limbic  systemAnatomy of  limbic  system
Anatomy of limbic system
 
Hematemesis in children-Beyond Infancy
Hematemesis in children-Beyond InfancyHematemesis in children-Beyond Infancy
Hematemesis in children-Beyond Infancy
 
Portal vein &amp; portocaval anastomosis
Portal vein &amp; portocaval anastomosis Portal vein &amp; portocaval anastomosis
Portal vein &amp; portocaval anastomosis
 
Tuning fork test
Tuning fork testTuning fork test
Tuning fork test
 
Adrenal gland endocrine-
Adrenal gland endocrine-Adrenal gland endocrine-
Adrenal gland endocrine-
 
Motor system pathways for students
Motor system pathways for studentsMotor system pathways for students
Motor system pathways for students
 
Development of midgut and pancreas
Development of midgut  and pancreas Development of midgut  and pancreas
Development of midgut and pancreas
 
Cerebellum
CerebellumCerebellum
Cerebellum
 
Approach to a poisoned child
Approach to a poisoned childApproach to a poisoned child
Approach to a poisoned child
 
The Sympathetic Nervous System
The Sympathetic Nervous SystemThe Sympathetic Nervous System
The Sympathetic Nervous System
 
Congenital anomalies of respiratory system A Radiological approach
Congenital anomalies of respiratory system A Radiological approachCongenital anomalies of respiratory system A Radiological approach
Congenital anomalies of respiratory system A Radiological approach
 
Short stature in children 2020
Short stature in children  2020Short stature in children  2020
Short stature in children 2020
 

Destacado

Study of wind effect on building with hexagonal cross section
Study of wind effect on building with hexagonal cross sectionStudy of wind effect on building with hexagonal cross section
Study of wind effect on building with hexagonal cross sectionDr. Bhuiyan S. M. Ebna Hai
 
Fluid motion in the posterior chamber of the eye
Fluid motion in the posterior chamber of the eyeFluid motion in the posterior chamber of the eye
Fluid motion in the posterior chamber of the eyeDr. Bhuiyan S. M. Ebna Hai
 
Design Analysis Of Uav (Unmanned Air Vehicle) Using NACA 0012 Aerofoil Profile
Design Analysis Of Uav (Unmanned Air Vehicle) Using NACA 0012 Aerofoil ProfileDesign Analysis Of Uav (Unmanned Air Vehicle) Using NACA 0012 Aerofoil Profile
Design Analysis Of Uav (Unmanned Air Vehicle) Using NACA 0012 Aerofoil ProfileDr. Bhuiyan S. M. Ebna Hai
 
Engineering Drawing
Engineering DrawingEngineering Drawing
Engineering DrawingLai Chun Tat
 

Destacado (7)

Study of wind effect on building with hexagonal cross section
Study of wind effect on building with hexagonal cross sectionStudy of wind effect on building with hexagonal cross section
Study of wind effect on building with hexagonal cross section
 
Dynamic behavior of catalytic converters
Dynamic behavior of catalytic convertersDynamic behavior of catalytic converters
Dynamic behavior of catalytic converters
 
Fluid motion in the posterior chamber of the eye
Fluid motion in the posterior chamber of the eyeFluid motion in the posterior chamber of the eye
Fluid motion in the posterior chamber of the eye
 
Engineering Drawing
Engineering DrawingEngineering Drawing
Engineering Drawing
 
Study of Aerodynamics of a Cricket Ball
Study of Aerodynamics of a Cricket BallStudy of Aerodynamics of a Cricket Ball
Study of Aerodynamics of a Cricket Ball
 
Design Analysis Of Uav (Unmanned Air Vehicle) Using NACA 0012 Aerofoil Profile
Design Analysis Of Uav (Unmanned Air Vehicle) Using NACA 0012 Aerofoil ProfileDesign Analysis Of Uav (Unmanned Air Vehicle) Using NACA 0012 Aerofoil Profile
Design Analysis Of Uav (Unmanned Air Vehicle) Using NACA 0012 Aerofoil Profile
 
Engineering Drawing
Engineering DrawingEngineering Drawing
Engineering Drawing
 

Similar a A simple model of the liver microcirculation

Effect Of Elasticity On Herschel - Bulkley Fluid Flow In A Tube
Effect Of Elasticity On Herschel - Bulkley Fluid Flow In A TubeEffect Of Elasticity On Herschel - Bulkley Fluid Flow In A Tube
Effect Of Elasticity On Herschel - Bulkley Fluid Flow In A TubeIJARIDEA Journal
 
Simulation of Solute Transport under Oscillating Groundwater Flow in Homogene...
Simulation of Solute Transport under Oscillating Groundwater Flow in Homogene...Simulation of Solute Transport under Oscillating Groundwater Flow in Homogene...
Simulation of Solute Transport under Oscillating Groundwater Flow in Homogene...Amro Elfeki
 
1. Oxygen transport from a single capillary into an organoid. A serio.pdf
 1. Oxygen transport from a single capillary into an organoid. A serio.pdf 1. Oxygen transport from a single capillary into an organoid. A serio.pdf
1. Oxygen transport from a single capillary into an organoid. A serio.pdfaggarwalenterprises1
 
Basic equation of fluid flow mechan.pptx
Basic equation of fluid flow mechan.pptxBasic equation of fluid flow mechan.pptx
Basic equation of fluid flow mechan.pptxAjithPArun1
 
Simulation of Pollution Transport in Coastal Aquifers under Tidal Movements
Simulation of Pollution Transport in Coastal Aquifers under Tidal MovementsSimulation of Pollution Transport in Coastal Aquifers under Tidal Movements
Simulation of Pollution Transport in Coastal Aquifers under Tidal MovementsAmro Elfeki
 
12 Fluid dynamics.pdf
12 Fluid dynamics.pdf12 Fluid dynamics.pdf
12 Fluid dynamics.pdfraymond960424
 
Analysis of the Interaction between A Fluid and A Circular Pile Using the Fra...
Analysis of the Interaction between A Fluid and A Circular Pile Using the Fra...Analysis of the Interaction between A Fluid and A Circular Pile Using the Fra...
Analysis of the Interaction between A Fluid and A Circular Pile Using the Fra...IJERA Editor
 
The International Journal of Engineering and Science (The IJES)
The International Journal of Engineering and Science (The IJES)The International Journal of Engineering and Science (The IJES)
The International Journal of Engineering and Science (The IJES)theijes
 
Fluid+flow
Fluid+flowFluid+flow
Fluid+flowMidoOoz
 
Module-3_FLUID KINEMATICS AND DYNAMICS.ppt
Module-3_FLUID KINEMATICS AND DYNAMICS.pptModule-3_FLUID KINEMATICS AND DYNAMICS.ppt
Module-3_FLUID KINEMATICS AND DYNAMICS.pptpayal_vinitshah
 
Conservation of Mass_ long form (Completed)
Conservation of Mass_ long form (Completed)Conservation of Mass_ long form (Completed)
Conservation of Mass_ long form (Completed)Dominic Waldorf
 
Fluids mechanics class 1 -Module 1
Fluids mechanics class 1 -Module 1Fluids mechanics class 1 -Module 1
Fluids mechanics class 1 -Module 1Mujeeb Muji
 

Similar a A simple model of the liver microcirculation (20)

Effect Of Elasticity On Herschel - Bulkley Fluid Flow In A Tube
Effect Of Elasticity On Herschel - Bulkley Fluid Flow In A TubeEffect Of Elasticity On Herschel - Bulkley Fluid Flow In A Tube
Effect Of Elasticity On Herschel - Bulkley Fluid Flow In A Tube
 
Simulation of Solute Transport under Oscillating Groundwater Flow in Homogene...
Simulation of Solute Transport under Oscillating Groundwater Flow in Homogene...Simulation of Solute Transport under Oscillating Groundwater Flow in Homogene...
Simulation of Solute Transport under Oscillating Groundwater Flow in Homogene...
 
1. Oxygen transport from a single capillary into an organoid. A serio.pdf
 1. Oxygen transport from a single capillary into an organoid. A serio.pdf 1. Oxygen transport from a single capillary into an organoid. A serio.pdf
1. Oxygen transport from a single capillary into an organoid. A serio.pdf
 
Basic equation of fluid flow mechan.pptx
Basic equation of fluid flow mechan.pptxBasic equation of fluid flow mechan.pptx
Basic equation of fluid flow mechan.pptx
 
Simulation of Pollution Transport in Coastal Aquifers under Tidal Movements
Simulation of Pollution Transport in Coastal Aquifers under Tidal MovementsSimulation of Pollution Transport in Coastal Aquifers under Tidal Movements
Simulation of Pollution Transport in Coastal Aquifers under Tidal Movements
 
Ostwald
OstwaldOstwald
Ostwald
 
Ostwald
OstwaldOstwald
Ostwald
 
12 Fluid dynamics.pdf
12 Fluid dynamics.pdf12 Fluid dynamics.pdf
12 Fluid dynamics.pdf
 
Analysis of the Interaction between A Fluid and A Circular Pile Using the Fra...
Analysis of the Interaction between A Fluid and A Circular Pile Using the Fra...Analysis of the Interaction between A Fluid and A Circular Pile Using the Fra...
Analysis of the Interaction between A Fluid and A Circular Pile Using the Fra...
 
The International Journal of Engineering and Science (The IJES)
The International Journal of Engineering and Science (The IJES)The International Journal of Engineering and Science (The IJES)
The International Journal of Engineering and Science (The IJES)
 
Fluid+flow
Fluid+flowFluid+flow
Fluid+flow
 
Module-3_FLUID KINEMATICS AND DYNAMICS.ppt
Module-3_FLUID KINEMATICS AND DYNAMICS.pptModule-3_FLUID KINEMATICS AND DYNAMICS.ppt
Module-3_FLUID KINEMATICS AND DYNAMICS.ppt
 
Conservation of Mass_ long form (Completed)
Conservation of Mass_ long form (Completed)Conservation of Mass_ long form (Completed)
Conservation of Mass_ long form (Completed)
 
Fluids mechanics class 1 -Module 1
Fluids mechanics class 1 -Module 1Fluids mechanics class 1 -Module 1
Fluids mechanics class 1 -Module 1
 
FluidKinematics.ppt
FluidKinematics.pptFluidKinematics.ppt
FluidKinematics.ppt
 
Fundamentals of fluid flow, Darcy's law, Unsaturated Condition, Reynolds Num...
Fundamentals of fluid flow, Darcy's law,  Unsaturated Condition, Reynolds Num...Fundamentals of fluid flow, Darcy's law,  Unsaturated Condition, Reynolds Num...
Fundamentals of fluid flow, Darcy's law, Unsaturated Condition, Reynolds Num...
 
8fmm.ppt
8fmm.ppt8fmm.ppt
8fmm.ppt
 
8fmm.ppt
8fmm.ppt8fmm.ppt
8fmm.ppt
 
Handout #3
Handout #3Handout #3
Handout #3
 
Chapter 3 Classification of Flow .doc
Chapter 3 Classification  of  Flow .docChapter 3 Classification  of  Flow .doc
Chapter 3 Classification of Flow .doc
 

Último

COVID-19 (NOVEL CORONA VIRUS DISEASE PANDEMIC ).pptx
COVID-19  (NOVEL CORONA  VIRUS DISEASE PANDEMIC ).pptxCOVID-19  (NOVEL CORONA  VIRUS DISEASE PANDEMIC ).pptx
COVID-19 (NOVEL CORONA VIRUS DISEASE PANDEMIC ).pptxBibekananda shah
 
April 2024 ONCOLOGY CARTOON by DR KANHU CHARAN PATRO
April 2024 ONCOLOGY CARTOON by  DR KANHU CHARAN PATROApril 2024 ONCOLOGY CARTOON by  DR KANHU CHARAN PATRO
April 2024 ONCOLOGY CARTOON by DR KANHU CHARAN PATROKanhu Charan
 
Biomechanics- Shoulder Joint!!!!!!!!!!!!
Biomechanics- Shoulder Joint!!!!!!!!!!!!Biomechanics- Shoulder Joint!!!!!!!!!!!!
Biomechanics- Shoulder Joint!!!!!!!!!!!!ibtesaam huma
 
call girls in Connaught Place DELHI 🔝 >༒9540349809 🔝 genuine Escort Service ...
call girls in Connaught Place  DELHI 🔝 >༒9540349809 🔝 genuine Escort Service ...call girls in Connaught Place  DELHI 🔝 >༒9540349809 🔝 genuine Escort Service ...
call girls in Connaught Place DELHI 🔝 >༒9540349809 🔝 genuine Escort Service ...saminamagar
 
call girls in munirka DELHI 🔝 >༒9540349809 🔝 genuine Escort Service 🔝✔️✔️
call girls in munirka  DELHI 🔝 >༒9540349809 🔝 genuine Escort Service 🔝✔️✔️call girls in munirka  DELHI 🔝 >༒9540349809 🔝 genuine Escort Service 🔝✔️✔️
call girls in munirka DELHI 🔝 >༒9540349809 🔝 genuine Escort Service 🔝✔️✔️saminamagar
 
PERFECT BUT PAINFUL TKR -ROLE OF SYNOVECTOMY.pptx
PERFECT BUT PAINFUL TKR -ROLE OF SYNOVECTOMY.pptxPERFECT BUT PAINFUL TKR -ROLE OF SYNOVECTOMY.pptx
PERFECT BUT PAINFUL TKR -ROLE OF SYNOVECTOMY.pptxdrashraf369
 
Glomerular Filtration and determinants of glomerular filtration .pptx
Glomerular Filtration and  determinants of glomerular filtration .pptxGlomerular Filtration and  determinants of glomerular filtration .pptx
Glomerular Filtration and determinants of glomerular filtration .pptxDr.Nusrat Tariq
 
call girls in green park DELHI 🔝 >༒9540349809 🔝 genuine Escort Service 🔝✔️✔️
call girls in green park  DELHI 🔝 >༒9540349809 🔝 genuine Escort Service 🔝✔️✔️call girls in green park  DELHI 🔝 >༒9540349809 🔝 genuine Escort Service 🔝✔️✔️
call girls in green park DELHI 🔝 >༒9540349809 🔝 genuine Escort Service 🔝✔️✔️saminamagar
 
Big Data Analysis Suggests COVID Vaccination Increases Excess Mortality Of ...
Big Data Analysis Suggests COVID  Vaccination Increases Excess Mortality Of  ...Big Data Analysis Suggests COVID  Vaccination Increases Excess Mortality Of  ...
Big Data Analysis Suggests COVID Vaccination Increases Excess Mortality Of ...sdateam0
 
PNEUMOTHORAX AND ITS MANAGEMENTS.pdf
PNEUMOTHORAX   AND  ITS  MANAGEMENTS.pdfPNEUMOTHORAX   AND  ITS  MANAGEMENTS.pdf
PNEUMOTHORAX AND ITS MANAGEMENTS.pdfDolisha Warbi
 
PULMONARY EMBOLISM AND ITS MANAGEMENTS.pdf
PULMONARY EMBOLISM AND ITS MANAGEMENTS.pdfPULMONARY EMBOLISM AND ITS MANAGEMENTS.pdf
PULMONARY EMBOLISM AND ITS MANAGEMENTS.pdfDolisha Warbi
 
Primary headache and facial pain. (2024)
Primary headache and facial pain. (2024)Primary headache and facial pain. (2024)
Primary headache and facial pain. (2024)Mohamed Rizk Khodair
 
world health day presentation ppt download
world health day presentation ppt downloadworld health day presentation ppt download
world health day presentation ppt downloadAnkitKumar311566
 
Wessex Health Partners Wessex Integrated Care, Population Health, Research & ...
Wessex Health Partners Wessex Integrated Care, Population Health, Research & ...Wessex Health Partners Wessex Integrated Care, Population Health, Research & ...
Wessex Health Partners Wessex Integrated Care, Population Health, Research & ...Wessex Health Partners
 
SWD (Short wave diathermy)- Physiotherapy.ppt
SWD (Short wave diathermy)- Physiotherapy.pptSWD (Short wave diathermy)- Physiotherapy.ppt
SWD (Short wave diathermy)- Physiotherapy.pptMumux Mirani
 
Measurement of Radiation and Dosimetric Procedure.pptx
Measurement of Radiation and Dosimetric Procedure.pptxMeasurement of Radiation and Dosimetric Procedure.pptx
Measurement of Radiation and Dosimetric Procedure.pptxDr. Dheeraj Kumar
 
Let's Talk About It: To Disclose or Not to Disclose?
Let's Talk About It: To Disclose or Not to Disclose?Let's Talk About It: To Disclose or Not to Disclose?
Let's Talk About It: To Disclose or Not to Disclose?bkling
 
Report Back from SGO: What’s New in Uterine Cancer?.pptx
Report Back from SGO: What’s New in Uterine Cancer?.pptxReport Back from SGO: What’s New in Uterine Cancer?.pptx
Report Back from SGO: What’s New in Uterine Cancer?.pptxbkling
 
Pharmaceutical Marketting: Unit-5, Pricing
Pharmaceutical Marketting: Unit-5, PricingPharmaceutical Marketting: Unit-5, Pricing
Pharmaceutical Marketting: Unit-5, PricingArunagarwal328757
 
SYNDESMOTIC INJURY- ANATOMICAL REPAIR.pptx
SYNDESMOTIC INJURY- ANATOMICAL REPAIR.pptxSYNDESMOTIC INJURY- ANATOMICAL REPAIR.pptx
SYNDESMOTIC INJURY- ANATOMICAL REPAIR.pptxdrashraf369
 

Último (20)

COVID-19 (NOVEL CORONA VIRUS DISEASE PANDEMIC ).pptx
COVID-19  (NOVEL CORONA  VIRUS DISEASE PANDEMIC ).pptxCOVID-19  (NOVEL CORONA  VIRUS DISEASE PANDEMIC ).pptx
COVID-19 (NOVEL CORONA VIRUS DISEASE PANDEMIC ).pptx
 
April 2024 ONCOLOGY CARTOON by DR KANHU CHARAN PATRO
April 2024 ONCOLOGY CARTOON by  DR KANHU CHARAN PATROApril 2024 ONCOLOGY CARTOON by  DR KANHU CHARAN PATRO
April 2024 ONCOLOGY CARTOON by DR KANHU CHARAN PATRO
 
Biomechanics- Shoulder Joint!!!!!!!!!!!!
Biomechanics- Shoulder Joint!!!!!!!!!!!!Biomechanics- Shoulder Joint!!!!!!!!!!!!
Biomechanics- Shoulder Joint!!!!!!!!!!!!
 
call girls in Connaught Place DELHI 🔝 >༒9540349809 🔝 genuine Escort Service ...
call girls in Connaught Place  DELHI 🔝 >༒9540349809 🔝 genuine Escort Service ...call girls in Connaught Place  DELHI 🔝 >༒9540349809 🔝 genuine Escort Service ...
call girls in Connaught Place DELHI 🔝 >༒9540349809 🔝 genuine Escort Service ...
 
call girls in munirka DELHI 🔝 >༒9540349809 🔝 genuine Escort Service 🔝✔️✔️
call girls in munirka  DELHI 🔝 >༒9540349809 🔝 genuine Escort Service 🔝✔️✔️call girls in munirka  DELHI 🔝 >༒9540349809 🔝 genuine Escort Service 🔝✔️✔️
call girls in munirka DELHI 🔝 >༒9540349809 🔝 genuine Escort Service 🔝✔️✔️
 
PERFECT BUT PAINFUL TKR -ROLE OF SYNOVECTOMY.pptx
PERFECT BUT PAINFUL TKR -ROLE OF SYNOVECTOMY.pptxPERFECT BUT PAINFUL TKR -ROLE OF SYNOVECTOMY.pptx
PERFECT BUT PAINFUL TKR -ROLE OF SYNOVECTOMY.pptx
 
Glomerular Filtration and determinants of glomerular filtration .pptx
Glomerular Filtration and  determinants of glomerular filtration .pptxGlomerular Filtration and  determinants of glomerular filtration .pptx
Glomerular Filtration and determinants of glomerular filtration .pptx
 
call girls in green park DELHI 🔝 >༒9540349809 🔝 genuine Escort Service 🔝✔️✔️
call girls in green park  DELHI 🔝 >༒9540349809 🔝 genuine Escort Service 🔝✔️✔️call girls in green park  DELHI 🔝 >༒9540349809 🔝 genuine Escort Service 🔝✔️✔️
call girls in green park DELHI 🔝 >༒9540349809 🔝 genuine Escort Service 🔝✔️✔️
 
Big Data Analysis Suggests COVID Vaccination Increases Excess Mortality Of ...
Big Data Analysis Suggests COVID  Vaccination Increases Excess Mortality Of  ...Big Data Analysis Suggests COVID  Vaccination Increases Excess Mortality Of  ...
Big Data Analysis Suggests COVID Vaccination Increases Excess Mortality Of ...
 
PNEUMOTHORAX AND ITS MANAGEMENTS.pdf
PNEUMOTHORAX   AND  ITS  MANAGEMENTS.pdfPNEUMOTHORAX   AND  ITS  MANAGEMENTS.pdf
PNEUMOTHORAX AND ITS MANAGEMENTS.pdf
 
PULMONARY EMBOLISM AND ITS MANAGEMENTS.pdf
PULMONARY EMBOLISM AND ITS MANAGEMENTS.pdfPULMONARY EMBOLISM AND ITS MANAGEMENTS.pdf
PULMONARY EMBOLISM AND ITS MANAGEMENTS.pdf
 
Primary headache and facial pain. (2024)
Primary headache and facial pain. (2024)Primary headache and facial pain. (2024)
Primary headache and facial pain. (2024)
 
world health day presentation ppt download
world health day presentation ppt downloadworld health day presentation ppt download
world health day presentation ppt download
 
Wessex Health Partners Wessex Integrated Care, Population Health, Research & ...
Wessex Health Partners Wessex Integrated Care, Population Health, Research & ...Wessex Health Partners Wessex Integrated Care, Population Health, Research & ...
Wessex Health Partners Wessex Integrated Care, Population Health, Research & ...
 
SWD (Short wave diathermy)- Physiotherapy.ppt
SWD (Short wave diathermy)- Physiotherapy.pptSWD (Short wave diathermy)- Physiotherapy.ppt
SWD (Short wave diathermy)- Physiotherapy.ppt
 
Measurement of Radiation and Dosimetric Procedure.pptx
Measurement of Radiation and Dosimetric Procedure.pptxMeasurement of Radiation and Dosimetric Procedure.pptx
Measurement of Radiation and Dosimetric Procedure.pptx
 
Let's Talk About It: To Disclose or Not to Disclose?
Let's Talk About It: To Disclose or Not to Disclose?Let's Talk About It: To Disclose or Not to Disclose?
Let's Talk About It: To Disclose or Not to Disclose?
 
Report Back from SGO: What’s New in Uterine Cancer?.pptx
Report Back from SGO: What’s New in Uterine Cancer?.pptxReport Back from SGO: What’s New in Uterine Cancer?.pptx
Report Back from SGO: What’s New in Uterine Cancer?.pptx
 
Pharmaceutical Marketting: Unit-5, Pricing
Pharmaceutical Marketting: Unit-5, PricingPharmaceutical Marketting: Unit-5, Pricing
Pharmaceutical Marketting: Unit-5, Pricing
 
SYNDESMOTIC INJURY- ANATOMICAL REPAIR.pptx
SYNDESMOTIC INJURY- ANATOMICAL REPAIR.pptxSYNDESMOTIC INJURY- ANATOMICAL REPAIR.pptx
SYNDESMOTIC INJURY- ANATOMICAL REPAIR.pptx
 

A simple model of the liver microcirculation

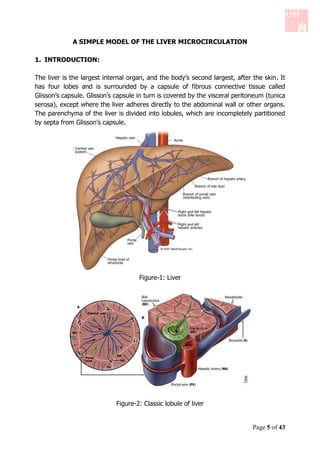
  • 1. A SIMPLE MODEL OF THE LIVER MICROCIRCULATION 1. INTRODUCTION: The liver is the largest internal organ, and the body’s second largest, after the skin. It has four lobes and is surrounded by a capsule of fibrous connective tissue called Glisson’s capsule. Glisson’s capsule in turn is covered by the visceral peritoneum (tunica serosa), except where the liver adheres directly to the abdominal wall or other organs. The parenchyma of the liver is divided into lobules, which are incompletely partitioned by septa from Glisson’s capsule. Figure-1: Liver Figure-2: Classic lobule of liver Page 5 of 43
  • 2. Figure-3: Classic lobule of liver The blood vessels supplying the liver (portal vein and hepatic artery) enter at the hilum (or porta hepatis), from which the common bile duct (carrying bile secreted by the liver) and lymphatic vessels also leave. Within the liver sinusoids, the oxygen-poor but nutrient rich blood from the portal vein mixes with the oxygenated blood from the hepatic artery. From the sinusoids, the blood enters a system of veins which converge to form the hepatic veins. The hepatic veins follow a course independent of the portal vessels and enter the inferior vena cava. The classic liver lobule is considered to be the functional unit of the organ. Each is a roughly hexagonally shaped, three dimensional unit, demarcated by connective tissue and constructed of the parenchymal cells of the liver, hepatocytes, in large numbers. On the picture to the right we can see the diagrammatic representation of a classic liver lobule, showing the organization of branches of the portal vein and hepatic artery, along with bile duct branches at the periphery of the lobule (in portal triads), and the central vein in the center of the lobule. As mentioned above, the liver receives a dual blood supply. The hepatic portal vein provides about 60% of the incoming blood, the rest comes from the hepatic artery. The Page 6 of 43
  • 3. blood from the portal vein has already supplied the small intestine, pancreas and spleen, and is largely deoxygenated. It contains nutrients and noxious materials absorbed in the intestine, blood cells and their breakdown products from the spleen, and endocrine secretions from the pancreas. The blood from the hepatic artery supplies the liver with oxygen. Because the blood from the two sources intermingles as it perfuses the liver cells, these cells must carry out their many activities under low oxygen conditions that most cells could not tolerate. In the process of transplanting a new liver in a patient, it is possible that the liver is smaller than the correct size and it takes some time for the new liver to grow and match the correct size in the new body. During the growth process, hypertensions in hepatic portal vein can occur due to the micro-vascular changes and the high rate of perfusion. Allowing some extra blood to bypass, a shunt may be inserted between the the portal veins and hepatic veins. Knowledge about the resistance of the flow through the liver, the relation between the pressure drop across the liver and the blood flow, is highly important for a proper shunt design. In this simple model, we present the pressure distribution and velocity profle across the hepatic lobules, which are the basic morph functional units of the liver. The lobule has approximately a hexagonal shape and the diameter of each lobule is about 1 mm (see Figure 2 and 3). We small focus on one lobule and calculate the pressure distribution and velocity profle across one lobule. 2. MATHEMATICAL MODEL OF THE fzOW IN THE LIVER LOBULE: We consider the liver as a two dimensional porous media and therefore we apply the assumptions of porous media in our modelling. 2.1 Flow in porous medium: We model the liver as a porous medium and consider it as a solid that has many interconnected pores. Due to the complexity of the geometry, solution of the Navier- Stocks equation in each individual pore, even in the linear form is complicated. In this case one good approach is to use the average velocity across the liver. Using the average velocity is valid as long as: S TA  S IP Wmere, S TA  Special scales of my whole area and S IP  Special scales of individual pores Page 7 of 43
  • 4. Also we consider the medium to be homogenous (characteristics of the medium is the same everywhere) and isotropic (no direction preference). In addition, we consider the porosity ɸ of the porous media as: V  P VT Wmere, V P =Volume of pores, VT = Total volume of tme area We consider the blood to be a Newtonian fluid and therefore the flow in the porous media is governed by Darcy equation: k q   p ( 1)  Where  q: volume flux per unit area of the medium. q is called the apparent velocity and is not the actual velocity. The actual average velocity within the pores is- u  q q  L T  k: permeability of the medium. Measures how strong are the solid against the flow. The larger the permeability constant, the lower is the resistance of the medium against the flow. k depends on porosity (ɸ) and the geometry of the pores (tortousity and the degree of interconnection). It is important to mention that k does not depend on the theology of the fluid. k   L2  μ: dynamical viscosity  p: fluid pressure For an incompressible fluid owing through an incompressible solid, the coninuitity equation is .q  0 Taking the divergence of the Darcy equation we get 2.p  0 Which means that the velocity field of an incompressible fluid is harmonic. 2.2 Modeling assumptions: We use a simple model as in Figure 4 with the following assumptions:  The lobules are treated as identical regular hexagonal prisms arranged in a lattice.  The diameter of the portal tracts and centrilobular veins are much smaller than the axial length of the lobules. Page 8 of 43
  • 5. The axial length of the lobules is long compared to the length of an edge of the hexagon.  End effects are neglected and the flow is treated as two-dimensional. Figure-4: Simple model for liver lobule 2.3 Problem Formulation: Our goal is to find the pressure distribution and velocity profile at every point in the liver lobule. We assume that:  The lobule is a two dimensional porous media  Portal tracts are modeled as point sources  Centrilobular veins are modeled as point sink Using the polar coordinates, the apparent velocity q  q r , q  of a two dimensional source/sink point centered in the origin satisfies the followings:  If we denote the total flux through any circle centered in origin as Q and the distance from the source/sink point as r, then 0  rq d  2rq 2 r r Q Q q 2r  Due to symmetry q  0 mere for sources we have Q > 0 and for sinks Q < 0. Using Darcy law [equation (1)], we can obtain the pressure distribution as Q p log r  c 2k Page 9 of 43
  • 6. Using the above scheme, the mathematical problem can be formulated as p.n  0 along the hexagon sides Where Q  and Q  denote the intensity of the sources and sinks, respectively and we assume Q   0 and Q   0 . Moreover, in the above expressions  is the Dirac function and n denotes the unit vector normal to the hexagon side. 2.4 Pressure distribution: To enforce p.n  0 , a good technique is to add infinite sources and sinks to our model. In a lattice of hexagons there are twice as many sources (angles of the hexagons) than sinks (centers of the hexagons). In order for the mass to be conserved the intensity of a sink has to be twice that of a source. The solution for the pressure in a single point (x,y) within the hexagon can then be expressed as:  2N Q   Q    2N   p( x, y )  lim    N    log  x  x   2   y  y i  2    log  x  x   2   y  y  2  2k   j 1 2k   i j j  i 1  Where N  denotes the number of sinks (and N   2 N  ), xi , y i  denotes the position of the i th source and xi , y i  the position of the j th sink. 2.4.1 Dimenii nzess variabzes: x x*  L q q*  U p p*  UL k Page 10 of 43
  • 7. Where L is the length of the side of the lobule, U is the characteristic velocity of the blood, and the pressure scaling is derived from the Darcy equation. Also, we assume that the flux per unit length Q  coming out of portal tracts can be written as: Q   Ud Where d is the diameter of a portal tract. 2.5 Pressure distribution in the dimensionless form reads:  2N d    log x   y   log x   y  2N d p ( x , y )  lim    * 2 * 2    2 2 * * *  * x * y  *  x* *  y * N      j 1 2 L   i i j j  i 1 2 L  q *  * p * Now, using the following dimensional values extracted from the lecture notes, we can compute the velocity profile and pressure distribution. L  500m d  50m U  4  10 3 ms 1 2.6 Simulation of the pressure distribution and velocity profie: 2.6.1 Description of the algorithm: 1. We take a rectangular domain with area 2 x n 2 y n  where x n and y n denote the number of points in the positive x and y axis, respectively. 2. We generate the sources and sinks using 4 vectors as follows: v1  1,0 1 3  v2   ,  2 2  3 3  w1   ,  2 2   3 3 w2   ,   2 2  The sinks and sources are the linear combination of these vectors. Page 11 of 43
  • 8. 3. Since the above source/sink generation won't end up in a symmetric domain, we choose a circular symmetric domain to calculate the pressure distribution formulated in equation (2), for example a good symmetric domain could be: 2 xn  y n  2 2 x n if x n  y n 3 2 x n  y n  y n if x n  y n 2 2 3 4. Choosing the dimensional values as L  500m , d  50m and U  4  10 3 ms 1 , we will calculate the pressure distribution and velocity profile using the dimensionless equations (2) and (3) in one hexagonal lobule. 5. Finally, we sketch the velocity profile and pressure distribution in one hexagonal lobule. Figure-5: Point generator vectors FEW PAGES ARE MISSING DUE TO @COPY RIGHT OF THIS ARTICLE Page 12 of 43
  • 9. 4. RESULTS: For the simulation part, we consider x n  15, y n  15 , and the grid size to be h  0.05 . Figure-5: Tme Source/sink distribution in liver lobules Figure-6: Pressure distribution in one mexagonal lobule Page 16 of 43
  • 10. Figure-7: Pressure distribution in one mexagonal lobule Figure 6 and 7 show the pressure distribution within a hexagonal liver lobule. It can be immediately noticed that the pressure in the portal tracts (blood entering points located at each of the vertices of the hexagonal lobule) and centrilobular veins (blood exiting points located in the center of the cross-section) are larger than the other areas. As a conclusion, the deformation of tissues which is the result of high pressure in the liver may occur in these entering/exiting areas. Figure-8: Velocity distribution in the liver lobule Page 17 of 43
  • 11. Figure 8 illustrates the velocity distribution in the liver lobule. It can be observed that p.n  0 is satisfied in all the sections of the hexagon, where n is the outward normal to each side of hexagon. 5. Conclusions Although our model is simple, it gives useful information about the pressure distribution and velocity pofile in a cross-section of the liver lobule. Note that considering the blood archeology, one can give a slightly more accurate distribution, especially considering the shear-thinning behavior of blood. This modification is useful in the implementation of a small liver and the shunt design. Page 18 of 43