
Recomendados
Más contenido relacionado
La actualidad más candente
La actualidad más candente (20)
Similar a Global automotive
Similar a Global automotive (20)
Último
Último (20)
Global automotive
- 1. November 27, 2009 Global: Automobiles November 27, 2009 Global: Automobiles Identifying global long-term winners: Toyota, Volkswagen and Fiat Three key structural trends to 2020 Introducing our GS Autos Scorecard Global Automotive Research Team We see BRICs growth and the carbon challenge as To identify long-term industrial winners within EMEA Stefan Burgstaller | Goldman Sachs International key influences on the next cycle. We identify and global autos we have measured our coverage Shane McKenna | Goldman Sachs International quantify three key structural trends the global against six key success factors (the GS Autos Tim Rothery | Goldman Sachs International Maty Ndiaye | Goldman Sachs International automotive industry will face in the next decade: Scorecard). We highlight Toyota, VW, Fiat, Anton Farlenkov | OOO Goldman Sachs Bank Hyundai, and Honda as well positioned. Artyom Golodnov | OOO Goldman Sachs Bank (1) Global economic realignment: we expect this US to drive up global car sales by 70% over the next Patrick Archambault | Goldman Sachs & Co. ten years, an US$86 bn/€60 bn opportunity. Attractive annual return potential Aditya Oberoi | Goldman Sachs & Co. Asia Despite a track record of underperformance, the Rajeev Das | Goldman Sachs Japan Co., Ltd. (2) The cost of CO2 compliance: we estimate a automotive sector has provided investors with Kota Yuzawa | Goldman Sachs Japan Co., Ltd. Yuichiro Isayama | Goldman Sachs Japan Co., Ltd. US$117 bn/€80 bn headwind to industry profits significant annual performance opportunities. The Yukihiro Koike | Goldman Sachs Japan Co., Ltd. over the next decade. spread between the annual top and bottom Rosa Kim | Goldman Sachs (Asia) L.L.C., Seoul Branch Sandeep Pandya | Goldman Sachs India SPL. (3) Negative mix-shift: emerging market growth performer has been an average 102% since 1973. GS SUSTAIN Research Team and changing consumer behavior could reduce Sarah Forrest, CFA | Goldman Sachs (Singapore) Pte industry profits by US$26 bn/€18 bn we believe. Long-term winners: Toyota, VW and Fiat Andrew Howard | Goldman Sachs International Marc Fox | Goldman, Sachs & Co. Our investment framework identifies Toyota Melissa Epperly | Goldman Sachs International Consolidation to pursue 'relevant scale' (rated Buy), VW (Conviction Buy) and Fiat (Buy) as Sara Finan | Goldman Sachs International To offset profit headwinds over the next decade, attractive long-term winners. we estimate the industry must double annualized In addition, we highlight Ford (Conviction Buy) as Coverage views net cost savings to 200 bp pa vs. the last cycle. our preferred global restructuring play. Europe: Attractive US: Attractive We believe consolidation will be part of the Japan: Attractive industry’s response, given limits to cost cutting. Given volatile returns, no auto company qualifies Asia: Attractive Our analysis highlights Fiat, PSA and Suzuki as for inclusion in our GS SUSTAIN focus list. attractive industrial partners. Stefan Burgstaller The Goldman Sachs Group, Inc. does and seeks to do business with +44(20)7552-5784 | stefan.burgstaller@gs.com Goldman Sachs International companies covered in its research reports. As a result, investors should Tim Rothery, CFA be aware that the firm may have a conflict of interest that could affect +44(20)7774-6987 | tim.rothery@gs.com Goldman Sachs International the objectivity of this report. Investors should consider this report as Patrick Archambault, CFA only a single factor in making their investment decision. For Reg AC (212) 902-2817 | patrick.archambault@gs.com Goldman, Sachs & Co. certification, see the end of the text. Other important disclosures follow Kota Yuzawa the Reg AC certification, or go to www.gs.com/research/hedge.html. +81(3)6437-9863 | kota.yuzawa@gs.com Goldman Sachs Japan Co., Ltd. Analysts employed by non-US affiliates are not registered/qualified as research analysts with FINRA in the U.S. The Goldman Sachs Group, Inc. Global Investment Research Goldman Sachs Global Investment Research 1
- 2. November 27, 2009 Global: Automobiles Table of contents Executive summary 13 Industry analysis: Global economic realignment 33 Industry analysis: CO2 challenge 49 Industry analysis: Mix-shift 69 Industry analysis: GS Autos Scorecard 75 Industry analysis: Consolidation 93 Investment framework 105 GS SUSTAIN: Overview 121 GS SUSTAIN: ESG framework 131 Company profiles 149 Disclosures 227 Analyst Contributors Anthony Ling, Global CIO, Keith Hayes DOR Asia, Anthony Carpet DOR Americas EUROPE AUTOS AMERICAS AUTOS ASIA AUTOS GS SUSTAIN GLOBAL ECONOMICS Stefan Burgstaller Patrick Archambault Rajeev Das Sarah Forrest, CFA Puneet Gambhir Jim O’Neill stefan.burgstaller@gs.com patrick.archambault@gs.com rajeev.das@gs.com sarah.forrest@gs.com puneet.gambhir@gs.com jim.oneill@gs.com Shane McKenna Aditya Oberoi Kota Yuzawa Andrew Howard Louise Nankiinga Dominic Wilson shane.mckenna@gs.com aditya.oberoi@gs.com kota.yuzawa@gs.com andrew.howard@gs.com louise.nankiinga@gs.com dominic.wilson@gs.com Tim Rothery Yuichiro Isayama Marc Fox Peter Berezin tim.rothery@gs.com yuichiro.isayama@gs.com marc.fox@gs.com SPECIAL SITUATIONS peter.berezin@gs.com Maty Ndiaye Yukihiro Koike Melissa Epperly Charles Burrows Anna Stupnytska maty.ndiaye@gs.com yukihiro.koike@gs.com melissa.epperly@gs.com charles.burrows@gs.com anna.stupnytska@gs.com Sherri Malek Rosa Kim Sara Finan sherri.malek@gs.com rosa.kim@gs.com sara.finan@gs.com Anton Farlenkov Sandeep Pandya Stian Obrestad anton.farlenkov@gs.com sandeep.pandya@gs.com stian.obrestad@gs.com Artyom Golodnov Kristina Obrtacova artyom.golodnov@gs.com Yipeng Yang kristina.obrtacova@gs.com yipeng.yang@ghsl.cn We would like to thank Brian J. Jacoby and Ashik Kurian for their help with and contributions to this report. The prices in the body of this report are based on the market close of November 24, 2009 unless otherwise indicated. Goldman Sachs Global Investment Research 2
- 3. November 27, 2009 Global: Automobiles A comprehensive investment framework for the global automotive sector Global autos offers significant annual performance potential in our view. As capital returns have converged in the wake of the economic crisis, we believe the sector now provides attractive investment opportunities at the bottom of the cycle. We believe the next business cycle will be dominated by BRIC growth and the carbon challenge. We identify and quantify three key structural trends: (1) global economic realignment; (2) the CO2 challenge; and, (3) negative mix-shift. Against this backdrop, we consider industry positioning a key proxy for long-term return potential. To capture this potential, we introduce the GS Auto Scorecard. This measures relative company positions against six key success factors. We believe that consolidation is also likely to become a part of the industry’s answer to substantial profit headwinds through the next cycle, as companies will pursue ‘relevant scale’ in terms of geographical exposure, economies of scale and technology. Our investment framework identifies Toyota (Buy), Volkswagen (Conviction Buy) and Fiat (Buy) as potential long-term winners among our global coverage. In addition to potential long-term winners, we highlight Ford (Conviction Buy) as our preferred global restructuring play. The credit crisis has hit the global automotive industry hard, leading to a convergence of industry margins and returns and creating attractive investment opportunities The global automotive industry was hit hard by the economic crisis, suffering unprecedented levels of demand destruction. Monthly annualised global sales fell 19% from peak levels in October 2007 to trough levels in March 2009, while global automotive production fell even further, down 34%. As a consequence of the impact of the credit crisis and significant foreign exchange movements, the cash returns of the automotive companies has converged over the last 18 months, accelerating a trend evident since 1999 (when the difference between the highest- and lowest-return company was 28.4%). We forecast that this spread will compress to 5.6% in 2011 as macro economic factors dominate. In our view, this will create an attractive investment opportunity at the bottom of the automotive cycle: we believe that the relative competitive positioning of individual automotive companies will lead to a divergence in returns thereafter, as the industry emerges from the crisis, prompting divergent equity performance. We expect the next business cycle to be dominated by BRIC growth and the carbon challenge and see three key structural trends facing the global automotive industry The automotive industry is at the centre of two significant developments: (1) significant economic growth in BRIC countries, and (2) the carbon challenge: to significantly reduce CO2 emissions. Against this backdrop, we identify, discuss and quantify three key structural trends facing the global automotive industry: Goldman Sachs Global Investment Research 3
- 4. November 27, 2009 Global: Automobiles 1. Global economic realignment: Given our economists’ forecast of a continued realignment in global economic output, we expect wealth levels in emerging economies to rise quickly, bringing a huge global population into the consumer class. As a result, we believe large new markets should open to the automotive industry over the coming decade. As consumers in those markets grow wealthier, the experience of already-developed economies suggests vehicle penetration could rise rapidly in these economies. The result will potentially be a significant expansion in the size of the global car market: we forecast an increase of 73% to 107 mn units in 2020, relative to the 2010E level or a 5.7% CAGR. On our forecasts, BRICs countries will account for almost 70% of this growth, growing at an 11% CAGR, with China becoming the world’s largest car market by 2020 (with car and light commercial vehicle sales of 30 mn units pa). In contrast, we expect the Triad (the US, Europe and Japan) markets to remain fairly stagnant over this period, given a lack of forecast population growth, relatively static income distribution and limited increases in per capita vehicle penetration. We estimate that the 45 mn unit global growth we forecast (allowing for incremental capacity investment) will present the global automotive industry with a potential US$86 bn (€60 bn) profit opportunity over the next decade. 2. The CO2 challenge: Passenger vehicle emissions account for 10% of current global emissions of greenhouse gases (GHG), roughly half the emissions generated by transportation in total. Faced with the challenge of achieving significant reductions in global GHG emissions, policy makers have focused their attention on the automotive industry through CO2 emissions targets. The announced regulations and indicated plans aim to significantly reduce emissions per vehicle over the next decade, as emissions regulations in the USA, Japan, Europe and China begin to converge. Regulators’ targets in Europe, North America and Japan look for an average 17% improvement in CO2 emissions from current levels by 2015/16, we estimate. This, we believe, can be achieved through improvements to the efficiency of the internal combustion engine, via improvements to engine technologies, transmission systems and accessories, and changed material use. However, the acceleration in vehicle demand we forecast will likely intensify pressure to develop alternative powertrain technologies, particularly electrification solutions. We estimate an incremental cost of US$117 bn (€80 bn) to the industry of complying with tightening CO2 emissions standards by 2020, representing US$2,400/€1,640 per vehicle in Europe, and US$2,100/€1,400 per vehicle in the USA. This estimate includes both additional R&D costs, and higher variable-cost spend, adjusted for a volume-led learning curve as the penetration of CO2 reducing technologies is expected to increase through the next 10 years. 3. The negative mix-shift: The global automotive industry is facing the threat of significant negative mix-shift towards smaller cars from: (1) economic realignment and associated growth in emerging markets, and (2) a downsizing trend within developed markets. We see the majority of incremental growth in demand through to 2020 coming from emerging economies, including the BRICs, where sales are typically more biased towards more affordable, smaller vehicles. Assuming that the current segment mix in each of the BRIC countries remains stable, we believe the growth in these markets should lead to a global shift towards smaller cars over the next 10 years. Data from developed economies also suggests consumers in those markets are increasingly turning to smaller cars, exacerbating the pace of change in the global mix. Government regulation will likely influence consumer behaviour, adding to the global mix-shift pressure. We estimate that the industry faces a potential headwind from this move to smaller cars of around US$26 bn (€18 bn), over and above CO2 reduction costs, and represents a shift which will potentially reposition the traditional profit centres of the industry away from the C/D/E segments. Goldman Sachs Global Investment Research 4
- 5. November 27, 2009 Global: Automobiles GS Autos Scorecard ranks across six key success factors; we highlight Toyota, Volkswagen, Fiat, Hyundai and Honda as well positioned To identify potential long-term winners within the global automotive industry, we have assessed our coverage universe against six key success factors. We highlight Toyota, Volkswagen, Fiat, Hyundai and Honda as well positioned global car companies. 1. Price/mix are key building blocks with which automotive companies can create a sustainable competitive advantage. The realized average price per unit sold can vary significantly by car company. Product mix in particular is one key factor explaining differences in average prices. We attempt to isolate this to get a better reading on individual brand equity and price premium potential. 2. Low-cost position: The automotive industry is a highly competitive industry which must cope with overcapacity, low pricing power and raw material and foreign exchange headwinds. To determine the relative cost position of the companies across our coverage universe, we have analyzed eight key factors: (1) theoretical average labor costs; (2) units per employee; (3) revenues per employee; (4) empirical break-even point; (5) capacity utilization; (6) growth-adjusted capex/depreciation; (7) revenues/net assets; and, (8) research and development/sales. 3. Economies of scale: As the industry faces structural challenges, we believe economies of scale are becoming more important. To establish relative scale, we focus on: (1) unit sales; (2) revenues; (3) the average capacity of the plants accounting for 80% of production; (4) percentage of cars produced from top-five platforms; and, (5) total numbers of cars produced from top-five platforms. 4. Financial health: Global winners are likely to benefit from good profitability, cash generation and strong balance sheets, as these factors provide a good basis for companies to invest in new technologies, maintain product development levels and manage the cyclical and structural challenges facing the industry. 5. Growth: Access to growth regions and segments will be a key factor driving relative growth profiles over the next ten years, we believe. We attempt to measure the exposure of business models to these two key drivers: (1) we calculate a theoretical organic sales growth rate, based on 2008 sales split by geography and our 2010-2020 regional growth forecasts; (2) we derive a theoretical organic growth profile for each company, based on 2008 segment exposures and our forecast mix-shift by segment to 2020. 6. CO2 efficiency: This part of our GS Auto Scorecard is meant to quantify the impact of tighter CO2 regulations facing the global automotive industry. We calculate the distance to required targets for each manufacturer in the US and Europe. In addition, we analyze by how much a manufacturer has improved its fleet CO2 emission over the last three years. Goldman Sachs Global Investment Research 5
- 6. November 27, 2009 Global: Automobiles Consolidation to pursue ‘relevant scale’; Fiat, Peugeot and Suzuki offer strategic value In this report, we demonstrate that the global automotive industry has worked hard to realize cost savings and efficiency gains, to offset headwinds to profits from raw material price inflation, regulatory costs and currency. We calculate the global industry realized an average 100 bp net cost saving pa through the last cycle (1998-2007). Over the next cycle, however, and based on our analysis of global industry headwinds, we estimate that annual net cost savings will have to double to 200 bp pa for the industry to maintain its average annual operating profit margin of 5%. Given our estimates for significant cost pressure over the next cycle, we believe that consolidation to pursue ‘relevant scale’ is likely to become part of the industry’s answer to the substantial headwinds to industry profitability. We believe car manufacturers need to achieve ‘relevant scale’ in terms of growth, size and technology, and see industry consolidation as a means of: (1) companies accessing growth markets; (2) improved cost positions from better fixed cost absorption; and, (3) funding the development of CO2-efficient internal combustion engine concepts, as well as the development of alternative powertrain solutions, such as electrification. Using the GS Global Auto Scorecard, we assess the potential benefits from combinations of companies within the industry: we consider potential improvement in industrial positioning, through improved economies of scale, lower-cost positions, and access to stronger CO2 technology portfolios (while allowing fro negative revenue synergies). We identify Fiat, Peugeot and Suzuki as of strategic value: all three companies are potentially attractive partners to five or more companies on the basis of this methodology. Comprehensive framework: industry position, M&A potential, Director’s Cut and GS SUSTAIN To identify long-term attractive global automotive companies, we have developed a comprehensive investment framework. This includes four key elements: 1. Industry positioning: We believe that the relative competitive positioning of any automotive company is a good proxy for its long-term return potential. We use our GS Global Auto Scorecard results to assess the competitive positioning of each company in our coverage. Toyota, Volkswagen, Fiat, Honda and Hyundai screen as best positioned in our scorecard. 2. M&A potential: Given our view that consolidation is likely to become part of the industry’s answer to significant profit headwinds over the next decade, we recognize the strategic value companies might offer to potential partners. Fiat, Peugeot and Suzuki screen as having strategic value to potential partners in our framework. 3. Director’s Cut: We use our Director’s Cut framework to identify relative valuation opportunities within our global coverage group. We find that returns-based measures of financial performance show a stronger relationship to valuation than other, more traditional financial measures (such as growth-based metrics). By focusing on cash flow rather than earnings, and gross rather than net assets, CROCI avoids the distorting influences of different accounting policies on reported earnings and asset values. Consequently, we find a closer correlation between CROCI and EV/GCI (enterprise value/gross cash invested) than between other measures of return on capital and earnings multiples. 4. GS SUSTAIN: The GS SUSTAIN framework for mature industries identifies the companies in each global industry best placed to sustain competitive advantage and superior returns on capital over the long term (3-5 years). Our analysis shows that companies able to sustain industry-leading returns on capital for three years or longer have consistently delivered equity market outperformance. The GS SUSTAIN framework is designed to identify those companies in each industry best positioned to sustain those returns in the future. That framework integrates analysis of the key drivers of corporate performance: (1) returns on capital; (2) industry positioning; and, (3) management quality with respect to environmental, social and governance (ESG) issues. Goldman Sachs Global Investment Research 6
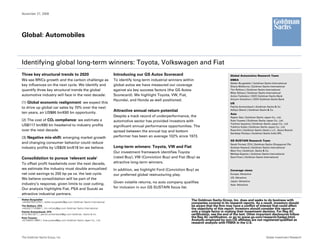
- 7. November 27, 2009 Global: Automobiles Identifying long-term winners: Toyota, Volkswagen and Fiat Exhibit 1: Identifying long-term winners: Toyota, Volkswagen and Fiat The credit crisis resulted in an unprecedented Significant demand growth and rising strategic The industry has historically struggled to Turning point generate attractive returns downturn in demand and intensified financial challenges will drive bifurcation in performance stress across the industry Global demand growth & realignment The carbon challenge Negative mix shift Consumer classes are expanding rapidly in Global CO2 emission standards must toughen Growth will be fastest for smaller vehicles, in which emerging economies, driving rapid growth in substantially and converge across regions if long- segments the industry has historically generated auto demand term global emissions targets are to be met lower levels of profitability Themes Consolidation: Required cost savings to offset headwinds over the next decade and allow the auto industry to cover its cost of capital are forecasts to be double those of the last decade driving more structural solutions and consolidation Investment Industry positioning Directors M&A Potential GS SUSTAIN Framework Cut M&A Analysis EV/ Return on Industry Management Low cost Economies GCI Capital Positioning Quality Pricing / mix position of scale = CROCI/ CROCI Scorecard ESG WACC Auto OEMs Cash return Assessment of Environmental, Return on on cash relative social and capital based invested industry governance Financial Growth CO2 valuation positioning issues health exposure efficiency approach Fiat, PSA, Renault, Fiat, No GS SUSTAIN Winners Leading Companies Toyota, Volkswagen, Fiat, Honda, Hyundai Suzuki Watchlist stocks: Toyota, Fiat and VW Ford, VW Global Winners Fiat, Toyota, Volkswagen Global Restructuring Ford Source: Goldman Sachs Research. Goldman Sachs Global Investment Research 7
- 8. November 27, 2009 Global: Automobiles Exhibit 2: Comprehensive framework: industry position, M&A potential, Director’s Cut and GS SUSTAIN GS SUSTAIN Industry Positioning Director's Cut 2011E Return Management Low cost Economies Financial Growth CO2 M&A (EV/GCI vs. on capital Quality Price-mix position of scale Health exposure efficiency Overall Potential CROCI/WACC) 2009-2011E ESG Score Toyota ●●● ●●●●● ●●●●● ●●●● ●● ●●●●● ●●●●● ● ● ●●●●● ●●● Volkswagen ●●●●● ●● ●●●●● ●●●● ●●●● ● ●●●●● ●● ●●●● ● ●●● Fiat ●●● ●●●●● ●● ●●● ●●●● ●●● ●●●● ●●●●● ●●●●● ●● ●●● Honda ●● ●●● ●●● ●●●●● ●●● ●●● ●●●● ●● ●● ●●●●● ●● Hyundai ● ●●●● ●●● ●● ●●●● ●●●●● ●●●● ● ● ●●●● ● BMW ●●●●● ● ● ●●●●● ● ●●● ●●● ● ●●●● ●●● ●●●●● Daimler ●●●●● ●●● ● ●●●●● ● ● ●●● ●● ●● ●●● ●●●●● Suzuki ● ●●●●● ● ●● ●●●●● ●● ●●● ●●●●● ● ●●●● ● Nissan ●●● ● ●●●● ●● ●● ●●● ●● ●●● ●●● ●●●●● ● Ford ●● ●● ●●●● ●● ● ●●●● ●● ●●● ●●●●● ●● ●● Peugeot ●● ●●● ●● ● ●● ●●●●● ●● ●●●●● ●●● ● ●●●●● Renault ●●● ● ●●●● ● ●●● ●● ●● ●●● ●●●●● ● ●●● Source: Company data, Goldman Sachs Research estimates. Exhibit 3: Director’s Cut (on 2011 estimates) Exhibit 4: GS Autos Scorecard: a useful proxy for long-term return potential 1.0x 1.0x y = 0.6113x - 0.3193 0.9x R2 = 0.4104 0.9x y = 0.3362x 0.8x 0.8x Honda Motor Suzuki Motor Honda Motor 0.7x Suzuki Motor 0.7x Hyundai Motor Hyundai Motor 0.6x 0.6x Toyota Motor EV/GCI Daimler AG EV/GCI 0.5x Daimler AG Toyota Motor 0.5x Ford 0.4x Nissan 0.4x Ford BMW BMW 0.3x Nissan Fiat 0.3x Peugeot Fiat 0.2x Volksw agen 0.2x Peugeot Volksw agen 0.1x 0.1x Renault Renault 0.0x 0.0x 0.0x 0.5x 1.0x 1.5x 2.0x 2.5x 3.0x 10 12 14 16 18 20 22 24 26 CROCI/WACC Scorecard Source: Company data, Goldman Sachs Research estimates. Source: Company data, Goldman Sachs Research estimates. Goldman Sachs Global Investment Research 8
- 9. November 27, 2009 Global: Automobiles Toyota Investment view Exhibit 5: Toyota scorecard spider Toyota achieved 24 points on the GS Autos Scoreboard, scoring as a long- term winner (in keeping with its reputation). The company is under short- term earnings pressure, amid a slump in global auto demand, but continues to leverage its solid balance sheet and invest for the long term, 1. Pricing/mix steadily extending its lead over competitors. 5 4 Toyota achieved the maximum five points in the economies of scale, low- cost position, and CO2 efficiency categories. In the area of CO2 emissions, 3 6. CO2 Efficiency 2. Low cost position Toyota was the first maker to commercialize hybrid technologies and has 2 built on these to develop expertise in a range of powertrain technologies 1 (from plug-in hybrids to fuel cells and electric vehicles). Hybrid vehicles now account for over 15% of Toyota’s annual sales, and it is the only maker 0 for which hybrids represent a stable earnings stream. In contrast, funding constraints have forced most automakers to pick and choose the types of next-generation powertrains they invest in, giving Toyota a strong 5. Grow th 3. Economies of scale advantage. We believe it may benefit from providing its hybrid and other technologies and parts to other firms in the future. The company achieved a low score in the growth category, reflecting its regional sales structure and its already large-scale production. Still, it is moving rapidly to develop 4. Financial health low-cost vehicles to be launched in emerging markets in 2010-2011 and is making efforts to expand production capacity in the growth markets of China and India. We believe customers in emerging markets are likely to demand more high-end vehicles as car ownership increases, and that Toyota’s market presence being relatively low should not be an obstacle to Analyst: Kota Yuzawa future growth. Rating: Buy We expect production momentum to dip temporarily in April-June 2010 on 12-month price target: ¥4,400 the end of government incentives, but Toyota has implemented a series of Price target methodology: Our ¥4,400 price target is based on an ROE-P/B restructuring measures—exiting Formula One, closing the US NUMMI correlation and our FY3/11 estimates. plant, and rearranging Japanese dealerships—in addition to the kaizen process that underpins its competitiveness, and we believe it can maintain Key risks to our price target: Key risks to our price target include a higher stable earnings. FY3/11 CROCI/WACC analysis puts Toyota’s expected yen/US$ exchange rate and an increase in US recall-related costs. return around the average for global automakers, but we consider it an attractive medium-term investment given its cash flow generating capabilities. We rate Toyota Buy. Source: Company data, Goldman Sachs Research estimates. Goldman Sachs Global Investment Research 9
- 10. November 27, 2009 Global: Automobiles Volkswagen Investment view Exhibit 6: Volkswagen scorecard spider We highlight Volkswagen as a global long-term winner in the automotive industry, achieving the second highest score on our GS Auto Scorecard analysis of six key success factors. Additionally, we see substantial potential upside to our price target for VW’s preferred shares. VW is a 1. Pricing/mix Conviction Buy with a 12-month price target of €107. We view VW as 5 structurally well positioned within the global automotive industry. VW 4 comprises a portfolio of strong brands, enjoys a price premium, is well 3 positioned to participate in BRICs growth (particularly China), and enjoys a 6. CO2 Efficiency 2. Low cost position 2 competitive advantage from its sector-leading modular component strategy in our view. VW score highest in terms of price/mix, reflecting its 1 position as the ‘desirable’ volume brand, realizing a 5%-7% price premium 0 over other competitors. With group sales of more than 6 mn units in 2009E, VW scores highly on economies of scale, particularly given the company’s leading component strategies. VW pioneered the platform sharing concept 5. Grow th 3. Economies of scale in the 1990s, and was one of the first auto makers in Europe to talk about component sharing to optimize economies of scale. In the next evolution of its component strategy, most likely with the launch of the new Golf in 2011/12, VW aims to use two generic platforms to optimize economies of 4. Financial health scale. With net cash of €9.8 bn in 2010E, VW scored well in terms of financial health, and with almost 30% of sales exposed to the BRIC market, VW is well positioned to participate in structural emerging market growth. VW has particularly strong market positions in Brazil and China, but is Analyst name: Stefan Burgstaller developing footholds in Russia and India. In addition, VW is focusing on Rating: Buy (on the European Conviction Buy List) the US market with the start-up of a new factory and the launch of a US 12-month price target: €107 specific D-segment vehicle. Despite significant structural changes to VW’s cost structure (particularly in Germany) in the years ahead of the financial Price target methodology: Mid-cycle EV/EBIT framework applied to our crisis, VW has significant potential to improve further its cost positioning 2010 forecasts. relative to peers. VW ranks comparatively poor in terms of CO2 efficiency Key risks to our price target: Lower volumes in 2010, CO2 compliance costs on 2008 data, as the group has made below-average progress towards and a value-destructive merger are key downside risks to our rating and achieving 2015/16 targets in Europe and the US (compared to other price target. manufacturers). VW’s score is most likely negatively impacted by its premium Audi brand, which naturally would inflate the CO2 data. As we move towards 2012, we expect VW to improve significantly the CO2 performance of its fleet. Source: Company data, Goldman Sachs Research estimates. Goldman Sachs Global Investment Research 10
- 11. November 27, 2009 Global: Automobiles Fiat Investment view Exhibit 7: Fiat Scorecard spider We highlight Fiat as long-term structural winner in the global automotive industry. Fiat ranks third on our GS Auto Scorecard of key success factors, in which we include potential scale benefits from Fiat’s close tie-up with 1. Pricing/mix Chrysler. Fiat has been the only global car maker with a strategic response 5 to the challenges of the credit crisis. We believe the Chrysler deal allows 4 Fiat to address its core weakness, a lack of economies of scale, and gives 3 the Italian car maker access to one of the largest car markets in the world. 6. CO2 Efficiency 2. Low cost position 2 Although Fiat has invested management time and talent in Chrysler, Fiat’s 1 ultimate 35% stake will be funded by sunk costs (i.e. sharing of platforms and technologies Fiat had already developed and expensed). 0 Fiat offers attractive potential upside to our price target. We rate Fiat Buy, with a 12-month price target of €14, including €2 bn for Fiat’s stake in 5. Grow th 3. Economies of scale Chrysler. Not surprisingly, Fiat achieved only an average score in terms of price/mix. Fiat is a small, no thrills car maker with a modest price point realization. Acknowledging this, Fiat’s strategy has been to offer the 4. Financial health appropriate level price point and up-sell to customers through options. Perhaps surprisingly, Fiat scored highly in terms of low-cost position compared to other car makers. Fiat operates in Tichy (Fiat 500, Panda), one of the most efficient car plants in Europe and is implementing its Japanese inspired world-class manufacturing programme. Even including Chrysler, the combined entity still ranks below par in terms of economies of scale. In the context of the automotive industry, Fiat has an average score in terms Analyst name: Stefan Burgstaller of financial health, but screens as attractively positioned in terms of growth. Fiat is the market leader in Brazil, and is developing its market Rating: Buy presence in Russia and India. To date, China remains Fiat’s weakness. 12-month price target: €14 Despite being a small car manufacturer, Fiat scores only in line with the average in terms of CO2 efficiency, based on our analysis of recent Price target methodology: Mid-cycle EV/EBIT framework applied to our improvements in CO2 and the distance to target levels set in Europe. 2010 forecasts. However, we believe that Fiat is developing a number of powertrain Key risks to our price target: Lower volumes, further cash burn and changes to improve its compliance with future CO2 requirements. In value-destructive M&A are key risks to our price target. addition to a good Scorecard score, Fiat screens as an attractive partner within the global automotive industry. Given the transformational changes achieved at Fiat, we are more optimistic for Chrysler’s performance potential under Fiat. Source: Company data, Goldman Sachs Research estimates. Goldman Sachs Global Investment Research 11
- 12. November 27, 2009 Global: Automobiles Ford Investment view Exhibit 8: Ford scorecard spider While Ford lags its best-in-class peers (e.g. Toyota, Volkswagen and Fiat) in terms of its long-term positioning (as measured by our scorecard), we consider it as the most attractive restructuring opportunity in our coverage. Firstly, we expect it to move up the ranks on a number of the metrics that 1. Pricing/mix make up the scorecard quite quickly. We highlight three areas in particular 5 in which it ranks below average, but where its shortcomings are being 4 addressed: (1) regarding price/mix, we expect significant improvement as 3 the company has moved away from a discount strategy in favour of 6. CO2 Efficiency 2. Low cost position smaller but more profitable market share. Indeed, the benefit of this model 2 has been evident in the last few quarters’ results; (2) we expect its low-cost 1 positioning to improve significantly, driven by the sizable restructuring it 0 has undertaken over the last 18 months. This has significantly lowered its fixed costs and reduced excess capacity; and, (3) we expect material growth improvement as the company continues to shift its footprint to 5. Grow th 3. Economies of scale flexible or car-based capacity to service what we expect will be a growing demand for passenger cars. We also see a growth advantage over the next 12 months from its high exposure to the North American market, were we expect sales to outpace 4. Financial health the global average. Our preference for Ford also reflects low market expectations, given its very challenged history which leads some to doubt it can ever attain even average sector profitability. As such, Ford screens well within our stock selection framework versus global peers. Our Analyst name: Patrick Archambault Director’s Cut framework identifies Ford as one of the more attractive stocks, the valuation of which is not fully discounting our expectations for Rating: Buy (on the Americas Conviction Buy List) cash flow and profitability. This is implicit in the enterprise value that is 6-month price target: US$11 implied by the sector’s CROCI/WACC trend line, which implies 25% potential upside for Ford. We also note Ford has among the largest Price target methodology: We value Ford’s shares using 2012 EBITDAP and expected changes in ROIC in our auto universe, albeit from a very low EPS, discounted back to the present at a 15% cost of equity. base, toward the industry mean: changes in ROIC have statistically been a Key risks to our price target: The greatest downside risk to our price target very good indicator of share price performance. would be prolonged weakness in US auto demand and a large downturn in Europe post government scrappage programs. Source: Company data, Goldman Sachs Research estimates.. Goldman Sachs Global Investment Research 12
- 13. November 27, 2009 Global: Automobiles Executive summary Goldman Sachs Global Investment Research 13
- 14. November 27, 2009 Global: Automobiles Attractive investment opportunities emerge as margins and returns converge The global automotive industry was hit hard by the economic crisis, suffering unprecedented levels of demand destruction. Monthly annualised global sales fell 19% from peak levels in October 2007 to trough levels in March 2009, while global automotive production fell even further, down 34%. As a consequence of the impact of the credit crisis and significant foreign exchange movements, the cash returns of the automotive companies has converged over the last 18 months, accelerating a trend evident since 1999 (when the difference between the highest- and lowest-return company was 28.4%). We forecast that this spread will compress to 5.6% in 2011 as macro economic factors dominate. In our view, this will create an attractive investment opportunity at the bottom of the automotive cycle: we believe that the relative competitive positioning of individual automotive companies will lead to a divergence in returns thereafter, as the industry emerges from the crisis, prompting divergent equity performance. Exhibit 9: Company returns have converged… Exhibit 10: …from a 21.7% spread in 2001 to a forecast 5.6% in 2011 Global autos: Companies aggregate CROCI (1998-2011E) CROCI dispersion (max vs. min.) and standard deviation (1998-2011E) 35% 30% 9% 8% 30% 25% 7% Standard deviation of CROCI 25% 20% 6% CROCI (max-min) 20% 5% 15% 15% 4% 10% 10% 3% 2% 5% 5% 1% 0% 0% 0% 2009E 2010E 2011E 1998 1999 2000 2001 2002 2003 2004 2005 2006 2007 2008 2009E 2010E 2011E 1998 1999 2000 2001 2002 2003 2004 2005 2006 2007 2008 -5% CROCI Low Median High CROCI Standard deviation Dispersion (max vs min) Source: Company data, Goldman Sachs Research estimates. Source: Company data, Goldman Sachs Research estimates. Goldman Sachs Global Investment Research 14
- 15. November 27, 2009 Global: Automobiles The next cycle will be influenced by BRICs growth and the carbon challenge The automotive industry is at the centre of two significant developments: (1) significant economic growth in BRIC countries; and, (2) the carbon challenge to reduce significantly CO2 emissions. BRICs growth: demand growth is migrating towards the large emerging markets and their surging middle classes, and away from US and European consumers. Our global economists named the BRICs (Brazil, Russia, India, and China) and the N11 (the next group of eleven large emerging economies) as key beneficiaries of this. In 2000, the BRIC economies accounted for 10% of global GDP. We forecast this to be 18% in 2010 and expect this to accelerate to 29% in 2020 and 48% in 2050 (Exhibit 11). Over the last 10 years, the BRIC economies have contributed nearly as much as Europe, the US and Japan combined to global GDP growth. Our global economists forecast that this trend will accelerate over the next year, with BRIC economies contributing 50% of global GDP growth, compared to a 27% contribution from Europe, the US and Japan. The carbon challenge: Population growth and economic development are placing mounting pressures on the global environment. Climate change is the highest profile of those pressures. Society’s awareness of the threats climate change presents, its causes, and its willingness to take action to drive the changes needed to avert the worst effects (whether directly or through support for political intervention) is increasing rapidly. On a global basis, transportation accounts around 20% of global CO2 emissions, with road traffic accounting for approximately half this. Exhibit 11: BRIC economies taking an increasing share of global GDP Exhibit 12: Global car park Share of global GDP by region, 1800-2050E Global car park by region, 2000, 2010E and 2020E (million units) 100% 1200 90% RoW 1000 80% BRICs 70% 800 Car Park - mn unit % of world GDP 60% 50% 600 40% Major developed 400 economies 30% 20% 200 10% 0 0% 2000 2010E 2020E 1800 1850 1900 1950 2000 2010E 2020E 2050E Triad BRIC RoW W Europe US Japan Brazil Russia India China RoW Source: GS Global ECS Research. Source: Global Insight, Goldman Sachs Research estimates. Goldman Sachs Global Investment Research 15
- 16. November 27, 2009 Global: Automobiles Three key structural trends facing the global automotive industry over the next decade Global economic realignment represents a US$86 bn (€60 bn) opportunity Given our economists’ forecast of a continued realignment in global economic output, we expect wealth levels in emerging economies to rise quickly, bringing a huge global population into the consumer class. As a result, we believe large new markets should open to the automotive industry over the coming decade. As consumers in those markets grow wealthier, the experience of already-developed economies suggests vehicle penetration could rise rapidly in these economies. The result will potentially be a significant expansion in the size of the global car market: we forecast an increase of 73% to 107 mn units in 2020, relative to the 2010E level. On our forecasts, BRIC countries will account for almost 70% of this growth, growing at an 11% CAGR, with China becoming the world’s largest car market by 2020 (with car and light commercial vehicle sales of 30 mn units pa). In contrast, we expect the Triad (the US, Europe and Japan) markets to remain stagnant over this period, given a lack of forecast population growth, relatively static income distribution and limited increases in per capita vehicle penetration. We estimate that the 45 mn unit growth we forecast (allowing for incremental capacity investment) will present the global automotive industry with a potential US$86 bn (€60 bn) profit opportunity over the next decade. Exhibit 13: Emerging markets are set to take an increasing share of the Exhibit 14: BRICs to contribute over 70% of growth in 2010-2020E global car market Contribution to global unit sales growth, 2010-2020E Unit volume (mn) for Triad and emerging markets, 1990-2020E 120 80% Contribution to global growth 2010E to 2020E 70% 100 60% 80 50% 40% 60 30% 40 20% 10% 20 0% BRIC China/Japan/India) E. Europe (ex RoW Japan Western Europe Triad Russia India China Other Brazil USA Russia) 0 Asia (ex 2010E 2012E 2014E 2016E 2018E 2020E 1990 1992 1994 1996 1998 2000 2002 2004 2006 2008 Triad Emerging Markets Source: Global Insight, Goldman Sachs Research estimates. Source: Global Insight, Goldman Sachs Research estimates. Goldman Sachs Global Investment Research 16