Europe & Israel 2016 VC Year in Review

Today, I’m happy to release a data-driven review of VC investment trends in Europe and Israel in 2016. I’ve tried to put some new and useful data points into the deck, so let me know what you think of the new stuff. And please let me know what else you think I should be tracking and showing in the deck next time. Some key highlights: Overall, investment volume was up in 4Q, but still below 2Q’s record high Total VC investment volume into Europe and Israel in 2016 was $14.5B, up from $12.1B in 2015, and increase of 20% There were six mega-deals (over $100M) in 4Q, and 15 in total in 2016 Excluding the megadeals, investment volume declined in 4Q, the second quarterly decline in a row Israel saw more VC investment activity than any other country in Europe with $3.9B in 2016. The UK and Germany were next with $3.0B and $2.3B, respectively US VCs invested in around 11% of European/Israeli venture rounds. Israel, the UK, and Germany led in terms of US VC participation Fintech was the most frequently funded vertical, with 178 investments. Marketing was second with 109 The categories that showed the most growth in frequency from 2015 to 2016 were Imagining (+400%), Agtech (+475%), and Automotive (+1100%) You’ll find all that and more in the 61-page report

Recomendados
Recomendados
Más contenido relacionado
La actualidad más candente
La actualidad más candente (19)
Similar a Europe & Israel 2016 VC Year in Review
Similar a Europe & Israel 2016 VC Year in Review (20)
Último
Último (20)
Europe & Israel 2016 VC Year in Review
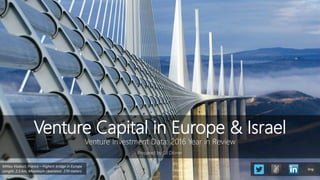
- 1. Venture Capital in Europe & Israel Venture Investment Data: 2016 Year in Review Prepared by Gil Dibner Millau Viaduct, France – Highest bridge in Europe Length: 2.5 km; Maximum clearance: 270 meters blog
- 2. The data • The data in this report consists entirely of data I’ve gathered manually based on publicly available, free sources • No paid data sources or API calls were harmed in the making of this dataset, every investment was manually classified • This allows analysis of some aspects of the data I consider important – aspects that don’t appear in other data sources. More importantly, it allows me to exclude deals that are really not “venture capital” rounds but tend to get included by others • Seed investment is under-reported and adds a lot of noise to the data set, so I exclude deals under $500K • The analysis is limited to ICT categories and excludes life sciences • The analysis excludes Turkey and FSU countries • I’m converting all currencies into USD using monthly average exchange rates Prepared by Gil Dibner follow me on (@gdibner), connect with me on , subscribe to my , or invest with me onblog 2
- 3. Top 10 deals by region in 2016 (US $M) France & Benelux IsraelIberia UK & Ireland DACH Nordic Prepared by Gil Dibner follow me on (@gdibner), connect with me on , subscribe to my , or invest with me onblog 3 35 35 37 38 47 50 75 108 109 150 Drivy Zenly Finanzcheck Navya Teads Showpad Tradeshift Devialet Deezer SigFox 0 50 100 150 200 60 70 70 72 76 89 96 100 180 300 Lumus Via Zerto Sirin ForeScout BlueVine Skybox Security Voyager Labs Payoneer Gett 0 100 200 300 400 20 21 21 25 33 35 36 38 49 88 The Future… Swap.com Visedo Vivino AlphaSense Klarna Neo4j M-Files StarBreeze Apptus 0 20 40 60 80 100 49 54 70 85 90 90 100 100 216 374 Movinga Brillen.de SoundCloud Sonnen Group Hello Fresh Heliatek Innogames MindMaze GoEuro Global Fashion Group 0 100 200 300 400 50 50 50 52 54 60 65 70 110 170 192 275 MUBI Intercom HighQ Nutmeg Blippar Student.com Darktrace Starling FarFetch FutureFinance Skyscanner Deliveroo 0 50 100 150 200 250 300 7 8 8 12 22 38 42 55 56 120 TravelPerk Coverwallet Verse ABA English Veniam CornerJob Jobandtalent OutSystems Hawkers Cabify 0 50 100 150
- 4. Top 10 deals by type 2016 (US $M) Systems SemiconductorEnterprise Consumer Financial Commerce Prepared by Gil Dibner follow me on (@gdibner), connect with me on , subscribe to my , or invest with me onblog 4 54 55 65 70 75 76 88 96 100 180 Blippar OutSystems Darktrace Zerto Tradeshift ForeScout Apptus Skybox Security Voyager Labs Payoneer 0 50 100 150 200 108 109 110 120 170 192 216 275 300 374 Devialet Deezer FarFetch Cabify FutureFinance Skyscanner GoEuro Deliveroo Gett Global Fashion Group 0 100 200 300 400 36 37 40 43 45 52 70 75 89 170 Tandem Finanzcheck Number26 EZBob World Remit Nutmeg Starling Tradeshift BlueVine FutureFinance 0 50 100 150 200 29 35 38 45 50 50 72 85 100 108 Airobotics Formlabs Navya Egym Phinergy Roboteam Sirin Sonnen Group MindMaze Devialet 0 20 40 60 80 100 120 45 50 54 56 90 110 192 216 275 374 Home24 Vroom Brillen.de Hawkers Hello Fresh FarFetch Skyscanner GoEuro Deliveroo Global Fashion Group 0 100 200 300 400 15 17 17 20 20 25 25 30 35 38 Kandou Bus Oryx MultiPhy ColorChip Valens Autotalks Satixfy GraphCore Acco Celeno 0 10 20 30 40
- 5. Quarterly pace of venture investment • In 4Q16, Europe & Israel saw $3.5 billion flowing into 450 venture transactions • This represents a slight improvement from 3Q16 and 4Q15 levels, but well below 2Q16 • In total, there was $14.5B of venture investment into Europe & Israel in 2016 in 1,795 transactions • These numbers, and the rest of this deck, do not reflect the $1B in debt raised by Spotify in March Prepared by Gil Dibner follow me on (@gdibner), connect with me on , subscribe to my , or invest with me onblog 5 2,873 3,139 3,252 2,857 3,730 4,114 3,122 3,519 0 100 200 300 400 500 600 0 500 1,000 1,500 2,000 2,500 3,000 3,500 4,000 4,500 Qtr1 Qtr2 Qtr3 Qtr4 Qtr1 Qtr2 Qtr3 Qtr4 2015 2016 Amountinvested(US$M) VC Investments in Europe & Israel Invested amount (US $M) Number of investments
- 6. Monthly pace of venture investment • Looked at on a monthly basis, the slight pick up in 4Q was due mostly to a strong October • December was seasonally weak in 2015 and 2016 • As would be expected, European & Israeli VC investment trends show seasonal slowdowns in summer (July, August) and winter (December) Prepared by Gil Dibner follow me on (@gdibner), connect with me on , subscribe to my , or invest with me onblog 6 905 971 997 791 787 1,561 1,518 571 1,164 1,084 1,059 715 1,657 1,051 1,021 1,401 1,452 1,261 725 1,101 1,296 1,457 1,170 893 0 20 40 60 80 100 120 140 160 180 200 0 200 400 600 800 1,000 1,200 1,400 1,600 1,800 Jan Feb Mar Apr May Jun Jul Aug Sep Oct Nov Dec Jan Feb Mar Apr May Jun Jul Aug Sep Oct Nov Dec Qtr1 Qtr2 Qtr3 Qtr4 Qtr1 Qtr2 Qtr3 Qtr4 2015 2016 Amountinvested(US$M) VC Investments in Europe & Israel (January 2015 - December 2016) Invested amount (US $M) Number of investments
- 7. Mega-rounds skew the investment totals • This analysis breaks down VC investments into brackets by size: • Seed (less than $2M) • Early venture ($2-8M) • Venture ($8-20M) • Growth ($20-100M) • Mega ($100M+) • Six mega-rounds took place in Europe in 4Q16 • Devialet (France, $108M) • GoEuro (Germany, $146M) • Innogames (Germany, $100M) • Sigfox (France, $150M) • Payoneer (Israel. $180M) • Voyager Labs (Israel, $100M) • Adjusting for mega-rounds, 4Q16 was about $110M less than 3Q16, the second quarterly decline in a row Prepared by Gil Dibner follow me on (@gdibner), connect with me on , subscribe to my , or invest with me onblog 7 354 371 510 602 635 592 707 716 567 559 730 695 752 651 813 1,513 1,187 1,650 1,679 1,336 1,197 0 500 1,000 1,500 2,000 2,500 3,000 3,500 4,000 4,500 Qtr2 Qtr3 Qtr4 Qtr1 Qtr2 Qtr3 Qtr4 2015 2016 AmountInvested(US$M) Pace of VC Investment in Europe and Israel Mega (>100) Growth (20-100) Venture (8-20) Early Venture (2-8) Seed (.5-2)
- 8. Strong year-over-year growth • 2016 saw 20% more venture investment than 2015 • Early venture deal volume increased 67%, venture volume increased 18%, growth volume increased 26%. • Mega-deal volume was down 18% Prepared by Gil Dibner follow me on (@gdibner), connect with me on , subscribe to my , or invest with me onblog 8 437 726 1,520 2,536 2,397 2,828 4,667 5,862 3,100 2,534 0 2,000 4,000 6,000 8,000 10,000 12,000 14,000 16,000 2015 2016 TotalVCinvestment(US$M) VC investmentvolume in Europe and Israel by bracket (2015 vs 2016) Mega (>100) Growth (20-100) Venture (8-20) Early Venture (2-8) Seed (<2)
- 9. Number of investments, by bracket • Excluding seed deals, the total number of VC investments per quarter was 275 in 4Q16, a new record level since I started tracking this data Prepared by Gil Dibner follow me on (@gdibner), connect with me on , subscribe to my , or invest with me onblog 9 77 85 94 140 153 157 144 181 42 62 44 46 61 57 64 53 33 26 38 35 44 52 40 35 6 6 4 3 4 4 1 6 0 50 100 150 200 250 300 Qtr1 Qtr2 Qtr3 Qtr4 Qtr1 Qtr2 Qtr3 Qtr4 2015 2016 NumberofVCinvestments VC investmentvolume in Europe and Israel by bracket Mega (>100) Growth (20-100) Venture (8-20) Early Venture (2-8)
- 10. No evidence of a Brexit effect on deal volume • The biggest story in the UK in 2016 was, undoubtedly, the Brexit referendum on June 23 • Looking just at UK VC deal volume, there’s so far no evidence that Brexit caused any slowdown whatsoever in VC activity • There were an average of 14 VC deals per month in 2H15 (pre- Brexit referendum) • There were an average of 19 VC deals per months in 2H16 (post- Bredit referendum) Prepared by Gil Dibner follow me on (@gdibner), connect with me on , subscribe to my , or invest with me onblog 10 0 5 10 15 20 25 30 Jul Aug Sep Oct Nov Dec Jan Feb Mar Apr May Jun Jul Aug Sep Oct Nov Dec Jan Feb Mar Apr May Jun Jul Aug Sep Oct Nov Dec Qtr3 Qtr4 Qtr1 Qtr2 Qtr3 Qtr4 Qtr1 Qtr2 Qtr3 Qtr4 2014 2015 2016 NumberofVCinvestments VC investmentvolume in the UK by bracket Mega (>100) Growth (20-100) Venture (8-20) Early Venture (2-8)
- 11. Corporate VC activity, by bracket • Excluding seed deals, the total number of corporate VC investments stayed flat at 44 in 4Q16 compared to 3Q16 • Overall, there were 196 corporate VC investments in Europe & Israel in 2016 compared to 123 in 2015, an increase of 59% Prepared by Gil Dibner follow me on (@gdibner), connect with me on , subscribe to my , or invest with me onblog 11 6 4 5 16 7 22 19 23 19 27 4 3 9 12 7 12 6 16 19 5 4 4 7 8 7 7 20 18 6 9 3 1 3 3 3 0 10 20 30 40 50 60 70 Qtr3 Qtr4 Qtr1 Qtr2 Qtr3 Qtr4 Qtr1 Qtr2 Qtr3 Qtr4 2014 2015 2016 NumberofVCinvestments CorporateVC investmentvolume in Europe and Israel by bracket Mega (>100) Growth (20-100) Venture (8-20) Early Venture (2-8)
- 12. Corporate VC activity, by country • During 2016, Israel saw the highest number of corporate VC investments, with 70 • The UK saw 39 corporate VC investments during the year • France and Germany each saw 21 corporate VC investments in 2016 • 13 other countries saw corporate VC activity across Europe, but at much lower levels Prepared by Gil Dibner follow me on (@gdibner), connect with me on , subscribe to my , or invest with me onblog 12 22 19 10 8 6 5 22 9 25 10 7 6 0 10 20 30 40 50 60 70 80 Israel UK Germany France Sweden Switzerland Spain Italy Belgium Finland Denmark Norway Iceland Estonia Netherlands Poland Portugal Numberofinvestments Number of corporate VC investments in Europeand Israel by bracket (2016) Mega (>100) Growth (20-100) Venture (8-20) Early Venture (2-8)
- 13. Average round size • Previously, I presented this broken down by bracket, but I think the data is more meaningful when taken in aggregate. • This average excludes seed rounds and mega rounds, so it reflects all rounds done in Europe & Israel between $2M and $100M • With very few exceptions, most months saw average round sizes of $10-12M and there is seems to be little pattern other than mean reversion • 3Q15 is the only systematic outlier to this trend, with average round sizes of $12- 15M throughout the quarter • Round sizes seemed to dip in 4Q16, with November seeing the lowest average round size since September 2014 Prepared by Gil Dibner follow me on (@gdibner), connect with me on , subscribe to my , or invest with me onblog 13 4 6 8 10 12 14 16 18 20 Jul Aug Sep Oct Nov Dec Jan Feb Mar Apr May Jun Jul Aug Sep Oct Nov Dec Jan Feb Mar Apr May Jun Jul Aug Sep Oct Nov Dec Qtr3 Qtr4 Qtr1 Qtr2 Qtr3 Qtr4 Qtr1 Qtr2 Qtr3 Qtr4 2014 2015 2016 AmountInvested(US$M) Average investmentsize in Europe and Israel (Round sizes of 2-100M)
- 14. Total venture investment by country, 4Q 2016 • Israel saw the most VC investment in 2016, with $3.9B raised • The UK came in second place, with $3B raised • Germany saw the third- highest amount of venture investment, with $2.3B Prepared by Gil Dibner follow me on (@gdibner), connect with me on , subscribe to my , or invest with me onblog 14 3,974 3,033 2,270 1,795 712 419 382 305 300 280 199 128 122 107 103 83 56 47 45 36 35 18 7 5 5 5 4 4 2 1 1 1 Israel UK Germany France Sweden Spain Ireland Netherlands Switzerland Finland Belgium Denmark Norway Italy Portugal Poland Austria Serbia Luxembourg Iceland Estonia Bulgaria Czech Slovenia Greece Latvia Lithuania Slovakia Albania Hungary Romania Croatia Total VC investmentvolumeby country, 2016 (US $M)
- 15. Total venture investment by country, 3Q14 to 4Q16 • To get a better sense of VC volumes in various countries, this analysis excludes mega- rounds • With this filter, volumes and rankings are more consistent • The biggest change in 4Q16 was a dramatic decline in Israeli VC volume, down to the lowest quarterly level in the past two years, but still just clinging to its first-place rank • What is most notable important about this chart is the consistent gradual growth in Germany, France, and Sweden Prepared by Gil Dibner follow me on (@gdibner), connect with me on , subscribe to my , or invest with me onblog 15 315 567 543 475 628 699 963 1,064 877 490 369 267 719 437 625 444 871 553 544 487 180 284 389 209 379 340 335 392 460 463 29 163 118 232 279 224 279 367 339 443 74 123 89 112 140 84 139 151 198 224 Qtr3 Qtr4 Qtr1 Qtr2 Qtr3 Qtr4 Qtr1 Qtr2 Qtr3 Qtr4 0 200 400 600 800 1000 1200 TotalVCinvestment(US$M) TotalVC investment,3Q14 - 4Q16 (top 5 countries, excluding mega-rounds) Israel UK Germany France Sweden
- 16. Total venture investment by country, 3Q14 to 4Q16 • To get a better sense of VC volumes in various countries, this analysis excludes mega- rounds • The “second five” countries for VC investment in 2016 were Finland, Ireland, the Netherlands, Spain, and – somewhat surprisingly - Switzerland • After two very solid quarters, the Netherlands seemed to revert back to lower levels • Switzerland edged out Denmark to round out the top ten Prepared by Gil Dibner follow me on (@gdibner), connect with me on , subscribe to my , or invest with me onblog 16 Qtr3 Qtr4 Qtr1 Qtr2 Qtr3 Qtr4 Qtr1 Qtr2 Qtr3 Qtr4 2014 2015 2016 0 20 40 60 80 100 120 140 160 180 TotalVCinvestment(US$M) TotalVC investment,3Q14 - 4Q16 (countries ranked 6-10 in 2016, excluding mega-rounds) Spain Ireland Netherlands Switzerland Finland
- 17. Average venture round sizes, by region • For a while, I had been seeing a trend towards convergence in the sizes of rounds across the geography • In 2016, this trend seems to be holding • Most regions saw average round sizes flat or slightly down • The DACH region saw a significant increase in average round size in 4Q16 compared to 4Q15 Prepared by Gil Dibner follow me on (@gdibner), connect with me on , subscribe to my , or invest with me onblog 17 Benelux,4.7 Benelux,7.5 DACH, 14.9 DACH, 16.2 France, 8.2 France, 7.6Iberia,7.2 Iberia,9.1 Israel,15.9 Israel,11.8Nordic,11.5 Nordic,7.0 UK & Ireland,8.5 UK & Ireland,8.6 0.0 2.0 4.0 6.0 8.0 10.0 12.0 14.0 16.0 18.0 Qtr4 Qtr4 Qtr4 2014 2015 2016 Averageroundsize(US$M) Average investmentsize in Europe and Israel (rounds of $2-100M)
- 18. Total venture investment by region • When VC investments across Europe are aggregated into regions, UK & Ireland, Israel, DACH, France, and the Nordics are the clear and consistent leaders • Benelux, Iberia, Southern Europe, and Eastern Europe do produce meaningful VC investments, but the volumes are still low Prepared by Gil Dibner follow me on (@gdibner), connect with me on , subscribe to my , or invest with me onblog 18 Israel,3,974 UK & Ireland,3,415 DACH, 2,626 France, 1,795 Nordic,1,322 Benelux,549 Iberia,523 South.Eur., 167 East.Eur., 114 TotalVC investmentby region, 2016
- 19. Rounds by bracket & region • To get a better sense of deal volume, this analysis excludes seed deals which are often poorly reported • Excluding seed deals, the UK and Ireland saw 63 venture deals in the fourth quarter • France took second place, with 55 • The Nordics had a very busy quarter, with 49 deals, up from 30 in 3Q • Israel dropped to fourth place, with only 43 deals, down from 62 in 3Q Prepared by Gil Dibner follow me on (@gdibner), connect with me on , subscribe to my , or invest with me onblog 19 42 38 39 23 19 9 5 3 3 12 10 6 11 7 1 3 1 9 5 4 7 8 1 1 2 2 2 0 10 20 30 40 50 60 70 UK & Ireland France Nordic Israel DACH Iberia Benelux East. Eur. South. Eur. Numberofinvestments Number of investments in Europe and Israel by bracket, 4Q 2016 Mega (>100) Growth (20-100) Venture (8-20) Early Venture (2-8)
- 20. Participation rate of US VC firms, by bracket • In the fourth quarter, US VCs participated in 8% of the VC financing rounds in EU and Israel • As usual, US VCs are much more likely to participate in later rounds • US VCs participated in only 1 of 6 mega-rounds in 4Q16 Prepared by Gil Dibner follow me on (@gdibner), connect with me on , subscribe to my , or invest with me onblog 20 0% 9% 17% 23% 17% 100% 91% 83% 77% 83% 0% 10% 20% 30% 40% 50% 60% 70% 80% 90% 100% Seed (.5-2) Early Venture (2-8) Venture (8-20) Growth (20-100) Mega (>100) Percentageofrounds Did US VC firms participatein EuropeanVC rounds? (4Q16) No Yes
- 21. US VC firm participation rate drops in 4Q • In 4Q, US VCs participated in about 12% of the rounds that took place in Europe • This rate is the lowest since I’ve been tracking the data • This analysis excludes seed and mega-rounds Prepared by Gil Dibner follow me on (@gdibner), connect with me on , subscribe to my , or invest with me onblog 21 15% 23% 17% 20% 20% 16% 16% 21% 21% 12% 0% 10% 20% 30% 40% 50% 60% 70% 80% 90% 100% Qtr3 Qtr4 Qtr1 Qtr2 Qtr3 Qtr4 Qtr1 Qtr2 Qtr3 Qtr4 2014 2015 2016 PercentageofRounds Did US VC firms participatein EuropeanVC rounds? (Rounds of $2M-$100M, 3Q14-4Q16) No US VC in the round US VC in the round
- 22. US VC firm participation rate vary widely by country • Rates of US VC participation vary wide across different countries • On this metric, in 2016, Estonia, Israel, and Portugal leap to the top of the list, with 60%, 34%, and 29% respectively • Italy and France bring up the rear, with only 6% and 5% Prepared by Gil Dibner follow me on (@gdibner), connect with me on , subscribe to my , or invest with me onblog 22 100% 60% 34% 29% 26% 24% 24% 23% 22% 13% 11% 10% 10% 8% 6% 6% 5% 0% 10% 20% 30% 40% 50% 60% 70% 80% 90% 100% Bulgaria Estonia Israel Portugal Switzerland Ireland Netherlands Germany Poland UK Sweden Finland Spain Norway Belgium Italy France PercentageofDollarsInvested Did US VC firms participatein EuropeanVC rounds? (2016) No US VC in the round US VC in the round
- 23. Participation of US VC firms by country • In 2016, US VCs firms were active in 17 different European countries • US VC firms were most active in Israel, where they participated in 80 investment rounds • The UK saw 31 US investments • US VCs invested in 26 German companies • France and Sweden both saw 9 US VC investments in 2016 Prepared by Gil Dibner follow me on (@gdibner), connect with me on , subscribe to my , or invest with me onblog 23 80 31 26 9 9 7 50 10 20 30 40 50 60 70 80 90 Israel UK Germany France Sweden Switzerland Netherlands Ireland Spain Estonia Finland Portugal Poland Bulgaria Belgium Italy Norway NumberofVCinvestments Rounds with a US VC involved (2016)
- 24. Participation of US VC firms by country • This chart shows US VC activity within Europe throughout 2015 and 2016 • The overwhelming bulk of US VC activity is generally in Israel, the UK & Ireland, DACH • In 4Q, there was only 1 US VC investment in the UK & Ireland • The Nordics, however, continued to show strength – rising to 6 US VC investments in 4Q16 Prepared by Gil Dibner follow me on (@gdibner), connect with me on , subscribe to my , or invest with me onblog 24 Israel,12 Israel,14 Israel,14 Israel,14 Israel,16 Israel,27 Israel,25 Israel,12 UK & Ireland,10 UK & Ireland,14 UK & Ireland,10 UK & Ireland,8 UK & Ireland,11 UK & Ireland,11 UK & Ireland,12 UK & Ireland,1 DACH, 8 DACH, 6 DACH, 4 DACH, 9 DACH, 6 DACH, 8 DACH, 8 DACH, 11 Nordic,2 Nordic,3 Nordic,5 Nordic,5 Nordic,5 Nordic,4 Nordic,6 Iberia,3 Iberia,4 Iberia,3 Iberia,2 France, 3 France, 2 France, 2 France, 3 France, 3 Benelux,5 Benelux,3 Benelux,3 0 10 20 30 40 50 60 Qtr1 Qtr2 Qtr3 Qtr4 Qtr1 Qtr2 Qtr3 Qtr4 2015 2016 NumberofVCinvestments Investments with US VC participation Israel UK & Ireland DACH Nordic Iberia France Benelux East. Eur. South. Eur.
- 25. Dimension Categories Explanation/Example 1. Target market Consumer, SMB, Enterprise, Government, Telecom, OEM What sort of customer does the company target? 2. Vertical market Adtech, Communications, Data, Development, Durables, Education, Electronics, Employment, Energy, Fashion, Financial, Food, Gaming, Health, HMI, Industrial, Infrastructure, Lifestyle, Logistics, Marketing, Media, Productivity, Real Estate, Security, Sports, Storage, Transportation, Travel, Water What type of problem does the company solve? 3. Business model Commerce, Components, Content, Marketplace, SaaS, Semiconductors, Services, Software, Systems, How does the company make money? How is value delivered to customers? What are customers paying for? For example: Consumer + Travel + Marketplace AirBnB has built a travel-related marketplace for consumers Three-dimensional approach to sector mapping Prepared by Gil Dibner follow me on (@gdibner), connect with me on , subscribe to my , or invest with me onblog 25
- 26. • Excluding mega-rounds, investment activity decreased in both consumer and enterprise, continuing a trend from 3Q • Investment activity has been continued to trend up in OEM-oriented companies – with volumes nearly doubling in 4Q compared to 3Q What target markets are attracting the most VC investment in Europe & Israel? Prepared by Gil Dibner follow me on (@gdibner), connect with me on , subscribe to my , or invest with me onblog 26 980 850 1,177 931 1,076 1,244 1,097 1,004 953 804 910 1,110 1,654 1,640 1,269 962 275 224 270 182 150 163 187 219 423 0 500 1,000 1,500 2,000 2,500 3,000 3,500 Qtr1 Qtr2 Qtr3 Qtr4 Qtr1 Qtr2 Qtr3 Qtr4 2015 2016 TotalVCinvestments(US$M) European& Israeli venture financing by target market 3Q14 to 4Q16 (excluding mega-rounds, US $M) Agriculture Government Telecom OEM SMB Enterprise Consumer
- 27. • When Israel is excluded from the sample, 45% of all VC dollars in Europe went to consumer-oriented companies – the lowest level in two years • OEM-oriented companies continued their rise, accounting for 10% of all VC dollars in Europe in 4Q • Telecom also showed a resurgence, at 6% in 4Q • It’s nearly invisible in the graph, but Agtech accounted for 1.5% of total volume in 4Q Consumer investment leads Europe Prepared by Gil Dibner follow me on (@gdibner), connect with me on , subscribe to my , or invest with me onblog 27 62% 36% 56% 63% 62% 57% 53% 58% 52% 45% 18% 48% 34% 22% 24% 31% 35% 33% 32% 29% 6% 10% 4% 12% 8% 6% 5% 3% 7% 8% 5% 4% 2% 4% 5% 6% 5% 8% 10% 6% 6%8% 0% 10% 20% 30% 40% 50% 60% 70% 80% 90% 100% Qtr3 Qtr4 Qtr1 Qtr2 Qtr3 Qtr4 Qtr1 Qtr2 Qtr3 Qtr4 2014 2015 2016 Europeanventure financing by target market 3Q14 to 4Q16 (excluding Israel, percent of US $M) Agriculture Government Telecom OEM SMB Enterprise Consumer
- 28. • When the sample set is limited to rounds under $20M, the ratio of consumer to enterprise investments shifted a bit towards enterprise • Consumer investments as a percentage of rounds accounted for 41% of early rounds compared to 40% for enterprise Early-stage consumer deals come back Prepared by Gil Dibner follow me on (@gdibner), connect with me on , subscribe to my , or invest with me onblog 28 39% 50% 46% 41% 46% 50% 38% 46% 46% 41% 41% 36% 50% 47% 39% 35% 46% 40% 32% 40% 9% 7% 9% 6% 9% 5% 11% 7% 11% 7% 5% 5% 9% 7% 0% 10% 20% 30% 40% 50% 60% 70% 80% 90% 100% Qtr3 Qtr4 Qtr1 Qtr2 Qtr3 Qtr4 Qtr1 Qtr2 Qtr3 Qtr4 2014 2015 2016 Europeanventure financing by target market 3Q14 to 4Q16 (excluding Israel, rounds up to $20M, percent of US $M) Agriculture Government Telecom OEM SMB Enterprise Consumer
- 29. Breakdown by region & target market • In 2016, consumer companies represented the plurality of investments in all regions except for Israel and Benelux Prepared by Gil Dibner follow me on (@gdibner), connect with me on , subscribe to my , or invest with me onblog 29 945 1,847 1,709 831 537 304 2,407 1,179 431 564 526 349 Enterprise,Iberia, 194 192 343 165 304 182 160 0 500 1,000 1,500 2,000 2,500 3,000 3,500 4,000 4,500 Israel UK & Ireland DACH France Nordic Benelux Iberia South. Eur. East. Eur. Totalamountinvested(US$M) Investment in Europe and Israel by target market by region 2016 (US $M) Agriculture Government Telecom OEM SMB Enterprise Consumer
- 30. Distribution of investment rounds by country • Across Europe & Israel, 44% of VC investment rounds were in consumer companies in 2016 • Agtech accounted for 3% of investments in South Europe, and 2% in DACH and Israel • Nearly two-thirds of Israeli venture investments were into enterprise companies Prepared by Gil Dibner follow me on (@gdibner), connect with me on , subscribe to my , or invest with me onblog 30 67% 54% 52% 48% 47% 43% 32% 19% 21% 32% 32% 31% 36% 41% 48% 63% 5% 10% 10% 9% 11% 9% 14% 5% 9% 5% 6% 9% 0% 10% 20% 30% 40% 50% 60% 70% 80% 90% 100% South. Eur. Iberia France Nordic DACH UK & Ireland Benelux Israel Investment in Europe and Israel by target market by country 2016 (Number of investments) Consumer Enterprise SMB OEM Telecom Government Agriculture
- 31. Growth rounds by target market • The later-stage market in Europe & Israel diversified in 4Q16, with increased focus on OEM companies (20%) and SMB-oriented businesses (12%) Prepared by Gil Dibner follow me on (@gdibner), connect with me on , subscribe to my , or invest with me onblog 31 56% 37% 46% 56% 43% 39% 38% 43% 44% 34% 25% 41% 46% 25% 38% 50% 50% 50% 44% 32% 6% 7% 5% 9% 12% 3% 6% 5% 12% 6% 11% 6% 7% 5% 6% 5% 5% 20% 0% 10% 20% 30% 40% 50% 60% 70% 80% 90% 100% Qtr3 Qtr4 Qtr1 Qtr2 Qtr3 Qtr4 Qtr1 Qtr2 Qtr3 Qtr4 2014 2015 2016 Investment in Europe and Israel by target market (Rounds over $20M, number of investments) Government Telecom OEM SMB Enterprise Consumer
- 32. • Fintech was the most popular vertical across Europe & Israel, with 178 investments in the category • Marketing-related startups were the second most popular category with 109 investments in 2016 • Lifestyle (a catchall category for consumer commerce) was the third most popular vertical, with 99 Finance returned to being the top vertical Prepared by Gil Dibner follow me on (@gdibner), connect with me on , subscribe to my , or invest with me onblog 32 14 14 23 23 24 34 38 39 40 41 42 43 44 45 47 48 52 53 56 63 64 64 65 65 70 81 81 86 99 109 178 SCM ERP HMI Agtech Automotive Social Energy Development Real Estate Payments Gaming Education Entertainment Communications Productivity Fashion CRM Food Data Health Industrial Adtech Travel Logistics Employment Infrastructure Security Electronics Lifestyle Marketing Financial European& Israeli venture financing by target market 2016 (top 30 categories, number of investments)
- 33. • This graph shows number of investments in the top 16 verticals across 2015 and 2016 • Most categories showed significant increases, in line with the overall trend How have the most popular verticals grown? Prepared by Gil Dibner follow me on (@gdibner), connect with me on , subscribe to my , or invest with me onblog 33 Financial,97 Financial,145 Marketing, 106 Marketing, 95 Lifestyle,65 Lifestyle,84Security,60 Security,73Electronics,49 Electronics,75 Infrastructure, 55 Infrastructure, 66 Employment,42 Employment,64 Logistics,45 Logistics,58 Adtech,48 Adtech,55 Health,51 Health,45 Travel, 33 Travel, 58 Fashion,42 Fashion,43 Data, 37 Data, 43 Productivity,38 Productivity,40 Industrial,23 Industrial,55 Development,44 Development,30 Education, 32 Education, 40 Food, 28 Food, 44 Gaming, 31 Gaming, 36 Communications,25 Communications,41 0 200 400 600 800 1,000 1,200 2015 2016 European & Israeli venture financing by vertical market (top 15 verticals, number of investments)
- 34. • This graph shows the change in the number of investments by vertical across 2015 and 2016 • Automotive, agtech, and imaging skyrocketed in frequency • Strong growth was seen in CRM, industrial, energy, storage • Sport, dating, and music saw substantial declines Growth rates by vertical Prepared by Gil Dibner follow me on (@gdibner), connect with me on , subscribe to my , or invest with me onblog 34 Music,-80% Dating, -75% Sports, -50% Development, -11% Durables,-7% Social,-6% Legal, 0% Marketing, 3% Fashion,14% Health, 24% Productivity,24% ERP, 27% Adtech, 33% Education,34% Security, 35% Gaming, 35% Logistics,44% Infrastructure,47% Data, 51% Payments, 52% Lifestyle, 52% Employment, 67% Entertainment, 69% Electronics,76% Communications,80% Financial,84% Food, 89% Travel, 97% SCM, 100% Water, 100% Real Estate, 111% HMI, 130% Storage, 150% Energy, 171% Industrial,178% CRM, 189% Imaging,400% Agtech, 475% Automotive, 1100% Change in number of VC investments by vertical (2016 vs. 2015)
- 35. • Finance was once again the most frequently funded vertical • Consumer lifestyle companies took second place • Marketing was the third most frequently funded vertical, with enterprise-oriented marketing taking the lion’s share within that category Which verticals for which segments? Prepared by Gil Dibner follow me on (@gdibner), connect with me on , subscribe to my , or invest with me onblog 35 Employment Industrial CRM Food Data Logistics Electronics Infrastructure Health Marketing Lifestyle Financial 0 10 20 30 40 50 60 European& Israeli venture financing by target market 4Q, 2016 (number of investments, top 10 verticals) Consumer Enterprise SMB OEM Telecom Government
- 36. • This chart shows the ten most commonly funded verticals across Europe & Israel by quarter The most popular verticals in the past 2 years Prepared by Gil Dibner follow me on (@gdibner), connect with me on , subscribe to my , or invest with me onblog 36 Qtr3 Qtr4 Qtr1 Qtr2 Qtr3 Qtr4 Qtr1 Qtr2 Qtr3 Qtr4 2014 2015 2016 0 50 100 150 200 250 300 European& Israeli venture financing by vertical market (number of investments, top 10 verticals) Adtech Health Logistics Electronics Lifestyle Employment Security Infrastructure Marketing Financial
- 37. • Investors continue to favor financial and health investments • Fashion and gaming showed declines Consumer VC investment trends Prepared by Gil Dibner follow me on (@gdibner), connect with me on , subscribe to my , or invest with me onblog 37 Qtr3 Qtr4 Qtr1 Qtr2 Qtr3 Qtr4 Qtr1 Qtr2 Qtr3 Qtr4 2014 2015 2016 0 20 40 60 80 100 120 140 160 180 European& Israeli venture financing by consumer verticals (number of investments, top 10 verticals) Social Travel Health Fashion Food Electronics Logistics Gaming Lifestyle Financial
- 38. • Enterprise marketing seems to have levelled off as an area for VC investment • There was a marked decrease in security investments in 4Q • Most other enterprise segments were largely stable Enterprise VC investment trends Prepared by Gil Dibner follow me on (@gdibner), connect with me on , subscribe to my , or invest with me onblog 38 Qtr3 Qtr4 Qtr1 Qtr2 Qtr3 Qtr4 Qtr1 Qtr2 Qtr3 Qtr4 2014 2015 2016 0 20 40 60 80 100 120 140 160 180 European& Israeli venture financing by enterprise verticals (number of investments, top 10 verticals) CRM Financial Industrial Employment Development Data Infrastructure Adtech Security Marketing
- 39. • Security was the most commonly funded category in Israel, with 43 investments in 2016 • Infrastructure, marketing, and finance were next A closer look at Israeli venture in 2016 Prepared by Gil Dibner follow me on (@gdibner), connect with me on , subscribe to my , or invest with me onblog 39 Data Industrial Development Adtech Communications Electronics Financial Marketing Infrastructure Security 0 5 10 15 20 25 30 35 40 45 50 Israeli venture financing by target market 2016 (number of investments,top 10 verticals) Consumer Enterprise SMB OEM Telecom Government
- 40. • Israeli deal volume declined in 4Q relative to record- setting quarters earlier in the year • Much of this decline seems to be attributable to the Jewish high holidays which occurred this year in 4Q compared to 3Q in 2015 Pace of Israeli venture in 2016 Prepared by Gil Dibner follow me on (@gdibner), connect with me on , subscribe to my , or invest with me onblog 40 0 5 10 15 20 25 30 35 Jul Aug Sep Oct Nov Dec Jan Feb Mar Apr May Jun Jul Aug Sep Oct Nov Dec Jan Feb Mar Apr May Jun Jul Aug Sep Oct Nov Dec Qtr3 Qtr4 Qtr1 Qtr2 Qtr3 Qtr4 Qtr1 Qtr2 Qtr3 Qtr4 2014 2015 2016 NumberofVCinvestments VC investmentvolume in Israel by bracket Mega (>100) Growth (20-100) Venture (8-20) Early Venture (2-8) 2015-2016 monthly average = 18 2015-2016 monthly average = 18 Jewishholydays Jewishholydays
- 41. • Over the past 24 months, Israeli VC investment volume averaged $277M per month • 4Q trended below that level, but just slightly Pace of Israeli venture in 2016 Prepared by Gil Dibner follow me on (@gdibner), connect with me on , subscribe to my , or invest with me onblog 41 0 100 200 300 400 500 600 700 Jul Aug Sep Oct Nov Dec Jan Feb Mar Apr May Jun Jul Aug Sep Oct Nov Dec Jan Feb Mar Apr May Jun Jul Aug Sep Oct Nov Dec Qtr3 Qtr4 Qtr1 Qtr2 Qtr3 Qtr4 Qtr1 Qtr2 Qtr3 Qtr4 2014 2015 2016 AmountofVCinvestments(US$M) VC investmentvolume in Israel by bracket Mega (>100) Growth (20-100) Venture (8-20) Early Venture (2-8) 2015-2016 monthly average = $277
- 42. • The UK venture landscape was dominated by fintech, and consumer fintech in particular • Marketing (mostly for the enterprise) was the second- most funded category in the UK • Consumer lifestyle companies were the third most funded category in the UK The UK VC market in 2016 Prepared by Gil Dibner follow me on (@gdibner), connect with me on , subscribe to my , or invest with me onblog 42 CRM Development Education Productivity Real Estate Infrastructure Adtech Employment Lifestyle Marketing Financial 0 5 10 15 20 25 30 35 40 45 UK venture financing by target market 2016 (number of investments,top verticals) Consumer Enterprise SMB OEM Telecom
- 43. • Fintech led the German VC eco-system in 2016, with 24 investments • Consumer travel was next, with 11 • Logistics and fashion (mostly but not exclusively for the consumer) were tied at 9 each • Enterprise industrial also made a strong showing, with 7 investments in 2016 The German VC market in 2016 Prepared by Gil Dibner follow me on (@gdibner), connect with me on , subscribe to my , or invest with me onblog 43 Lifestyle Data Employment CRM Marketing Real Estate Industrial Logistics Fashion Travel Financial 0 5 10 15 20 25 30 German venture financing by target market 2016 (number of investments,top verticals) Consumer Enterprise SMB
- 44. • As with the UK and Germany, the Nordics also saw more fintech companies funded than any other vertical • Surprisingly, electronics tied with gaming for second place – split evenly between consumer electronics and OEM-oriented companies • Health took fourth place with 19 rounds The Nordic VC market in 2016 Prepared by Gil Dibner follow me on (@gdibner), connect with me on , subscribe to my , or invest with me onblog 44 Employment Entertainment Infrastructure Industrial Energy Lifestyle Health Gaming Electronics Financial 0 5 10 15 20 25 30 35 40 45 Nordic venture financingby target market 2016 (number of investments,top verticals) Consumer Enterprise SMB OEM Telecom Government
- 45. • Not surprisingly, Sweden saw the most actively among Nordic nations across most verticals – with particular strength in financial, gaming, energy and entertainment • Finland showed particular strength in gaming, health and infrastructure The Nordic VC market by country Prepared by Gil Dibner follow me on (@gdibner), connect with me on , subscribe to my , or invest with me onblog 45 Employment Entertainment Infrastructure Industrial Energy Lifestyle Health Gaming Electronics Financial 0 5 10 15 20 25 30 35 40 45 Nordic venture financingby target market 2016 (number of investments,top verticals) Sweden Finland Denmark Norway Estonia Iceland Latvia Lithuania
- 46. • Sweden is by far the most active venture market in the Nordics • Gaming was the single most funded category in Sweden, followed closely by consumer finance and consumer lifestyle The Swedish VC market in 2016 Prepared by Gil Dibner follow me on (@gdibner), connect with me on , subscribe to my , or invest with me onblog 46 Food Adtech Communications CRM Productivity Logistics Industrial Marketing Entertainment Health Energy Lifestyle Electronics Gaming Financial 0 5 10 15 20 25 30 Swedish venture financing by target market 2016 (number of investments,top verticals) Consumer Enterprise SMB OEM Telecom
- 47. • Across France, consumer lifestyle, consumer electronics, and consumer travel were the most frequently funded categories • Enterprise marketing was also significant The French VC market in 2016 Prepared by Gil Dibner follow me on (@gdibner), connect with me on , subscribe to my , or invest with me onblog 47 Education Data Real Estate Financial Food Logistics Marketing Travel Electronics Lifestyle 0 5 10 15 20 25 30 French venture financingby target market 2016 (number of investments,top verticals) Consumer Enterprise SMB OEM Telecom Government
- 48. • Italy dominated the consumer lifestyle and adtech categories • Poland and Italy each saw three electronics investments in 2016 Venture capital in Southern & Eastern Europe in 2016 Prepared by Gil Dibner follow me on (@gdibner), connect with me on , subscribe to my , or invest with me onblog 48 Employment Durables Data Agtech Productivity ERP Social Health Food Financial Travel Fashion Security Logistics Marketing Electronics Adtech Lifestyle 0 2 4 6 8 10 Venture financingby target market (S. Eur & E. Eur) 2016 (number of investments,top verticals) Italy Poland Greece Czech Slovenia Slovakia Serbia Croatia Romania Bulgaria Albania Hungary
- 49. • SaaS was the most funded business model in 2016, representing 27% of all VC dollars • As software eats the world, services are becoming an increasingly important business model for venture- backed startups • This continued into 2016, with services taking 24% of the venture dollars invested in Europe & Israel • Systems – complete physical products – took fourth place at 9% of all venture dollars • Marketplaces – businesses that serve a price discovery function – were just 6% SaaS above all (but keep an eye on systems) Prepared by Gil Dibner follow me on (@gdibner), connect with me on , subscribe to my , or invest with me onblog 49 SaaS, 3,202, 27% Services, 2,825, 24% Software, 1,680, 14% Commerce, 1,194, 10% Systems, 1,129, 9% Marketplace, 742, 6% Media, 533, 5% Components, 398, 3% Semiconductors, 242, 2% Materials, 6, 0% European & Israeli venture financing by target market 2016 (in US $M) (excluding mega-rounds)
- 50. • SaaS and Services remained the top two business models by funding volume • Commerce rose throughout 2016, taking third place in 4Q • Systems moved up from last place in early 2015 to fourth place in 4Q16 • Marketplaces hit a new low and were in last place for the first time Commerce resurgent and systems rising Prepared by Gil Dibner follow me on (@gdibner), connect with me on , subscribe to my , or invest with me onblog 50 0 200 400 600 800 1000 1200 Qtr3 Qtr4 Qtr1 Qtr2 Qtr3 Qtr4 Qtr1 Qtr2 Qtr3 Qtr4 2014 2015 2016 European& Israeli venture financing by business model (top seven, in US $M, excluding mega-rounds) Services SaaS Software Commerc e Marketpl ace
- 51. • This graph provides a quick overview of the ten most commonly funded segments across the top ten countries for those segments • In a nutshell: • UK consumer financial services • Israeli enterprise security software • French consumer electronics • Swedish, Finnish, and British games • French food commerce • And some other stuff…. EU+IL VC Cheat Sheet Prepared by Gil Dibner follow me on (@gdibner), connect with me on , subscribe to my , or invest with me onblog 51 0 10 20 30 40 50 60 70 80 90 Enterprise CRM SaaS Consumer Food Commerce Consumer Gaming Media Consumer Fashion Commerce SMB Financial Services Consumer Electronics Systems Enterprise Security Software Consumer Lifestyle Commerce Enterprise Marketing SaaS Consumer Financial Services Number of VC investments Investment in Europe & Israel by segment by country 2016 (top 10 segments, top 10 countries) UK France Israel Sweden Germany Spain Italy Netherlands Finland Belgium
- 52. Once again, but this time more SaaS! • During 2016, the most popular vertical by far for SaaS investments across the geography was marketing • CRM (which includes sales tooling) was a distant second • Productivity and developer tools were tied for third Prepared by Gil Dibner follow me on (@gdibner), connect with me on , subscribe to my , or invest with me onblog 52 0 10 20 30 40 50 60 70 80 90 100 Security Financial Adtech Employment Infrastructure Data Development Productivity CRM Marketing SaaS VC investmentin Europe and Israel by vertical and target market, 2016 (top 10 verticals) Consumer Enterprise Government SMB Telecom
- 53. Services investing in 2016 • This graph shows the top ten verticals within the services category in 2016 across Europe & Israel • Financial services were far and away the most frequently funded vertical – mostly for consumers and SMBs • Education services (edtech) was in (distant) second place, followed by logistics and adtech Prepared by Gil Dibner follow me on (@gdibner), connect with me on , subscribe to my , or invest with me onblog 53 0 20 40 60 80 100 120 140 160 Infrastructure Marketing Communications Health Entertainment Payments Adtech Logistics Education Financial Services VC investment in Europe and Israel by vertical and target market, 2016 (top 10 verticals) Consumer Enterprise Government SMB Telecom
- 54. Focus on Industrial • 2016 saw a dramatic rise in the number of industrial- oriented investments across Europe and Israel • These investments concentrated in Israel (16), France (13), the UK (11), Germany (10), and Sweden (9) Prepared by Gil Dibner follow me on (@gdibner), connect with me on , subscribe to my , or invest with me onblog 54 0 2 4 6 8 10 12 14 16 18 Qtr4 Qtr1 Qtr2 Qtr3 Qtr4 Qtr1 Qtr2 Qtr3 Qtr4 2014 2015 2016 Numnberofinvestments Industrial- VC investmentin Europe and Israel Lithuania Poland Iceland Norway Finland Ireland Spain Denmark Switzerland Belgium Netherlands Sweden Germany UK France Israel
- 55. Focus on consumer systems • 2016 also saw a substantial rise in the volume of consumer systems investments across Europe and Israel • $564M was invested into this category in 2016 across 74 rounds, up from $189M across 39 rounds in 2015 Prepared by Gil Dibner follow me on (@gdibner), connect with me on , subscribe to my , or invest with me onblog 55 0 5 10 15 20 25 0 20 40 60 80 100 120 140 160 180 200 Qtr3 Qtr4 Qtr1 Qtr2 Qtr3 Qtr4 Qtr1 Qtr2 Qtr3 Qtr4 2014 2015 2016 Numberofinvestments Amountinvested(US$M) Consumer Systems - VC investmentin Europeand Israel Amount Number
- 56. Focus on agtech • 2016 also saw growth in the number of agtech investments across Europe and Israel • There were 23 deals in the space in 2016, up from 4 in 2015 • In 2016, there were 5 agtech deals in Israel and 3 in each of the UK, France, and Switzerland Prepared by Gil Dibner follow me on (@gdibner), connect with me on , subscribe to my , or invest with me onblog 56 0 1 2 3 4 5 6 7 8 9 Qtr1 Qtr2 Qtr3 Qtr4 Qtr1 Qtr2 Qtr3 Qtr4 2015 2016 Numnberofinvestments Agtech - VC investment in Europe and Israel Austria Croatia Ireland Estonia Greece Spain Netherlands Sweden Norway Switzerland UK France Israel
- 57. Focus on agtech • $86M was invested into agtech startups across Europe and Israel in 2016, up from $13 in 2015 Prepared by Gil Dibner follow me on (@gdibner), connect with me on , subscribe to my , or invest with me onblog 57 0 1 2 3 4 5 6 7 8 9 0 5 10 15 20 25 30 35 40 45 Qtr4 Qtr2 Qtr3 Qtr4 Qtr1 Qtr2 Qtr3 Qtr4 2014 2015 2016 Numberofinvestments Amountinvested(US$M) Agtech - VC investment in Europe and Israel Amount Number
- 58. Focus on automotive • 2016 also saw 23 automotive deals across Europe & Israel, up from 2 in 2015 • France led in this category, with 6 investments, all in 2016 • The UK was second, with 5 Prepared by Gil Dibner follow me on (@gdibner), connect with me on , subscribe to my , or invest with me onblog 58 0 2 4 6 8 10 12 14 Qtr1 Qtr2 Qtr3 Qtr4 Qtr1 Qtr2 Qtr3 Qtr4 2015 2016 Numnberofinvestments Automotive- VC investmentin Europe and Israel Italy Finland Switzerland Sweden Netherlands Germany Israel UK France
- 59. Focus on automotive • $187M was invested into automotive startups across Europe and Israel in 2016, up from $27 in 2015 Prepared by Gil Dibner follow me on (@gdibner), connect with me on , subscribe to my , or invest with me onblog 59 0 2 4 6 8 10 12 14 0 20 40 60 80 100 120 140 Qtr1 Qtr2 Qtr3 Qtr4 Qtr1 Qtr2 Qtr3 Qtr4 2015 2016 Numberofinvestments Amountinvested(US$M) Automotivetech - VC investmentin Europe and Israel Amount Number
- 60. Based in , I was previously a partner at . Before that, I helped run the European seed program for . I moved to London after seven years in during which I worked as a VC with and . I’m originally from . My VC investments include and . Angel investments include and many more. If you found this useful, I hope you’ll subscribe to my blog. 60 Gil Dibner To invest in the best European & Israeli enterprise startups, consider backing me on here. Lots of exciting stuff in the pipeline – and you’ll be in pretty good company.
- 61. Thank you blog