Applied Math 40S Slides May 22, 2007
•
1 recomendación•387 vistas

Applications of periodic functions; a beginning. Moving between equations, graphs and tables of values.

Recomendados
Más contenido relacionado
La actualidad más candente
La actualidad más candente (19)
Destacado
Similar a Applied Math 40S Slides May 22, 2007
Similar a Applied Math 40S Slides May 22, 2007 (20)
Más de Darren Kuropatwa
Más de Darren Kuropatwa (20)
Último
Último (20)
Applied Math 40S Slides May 22, 2007
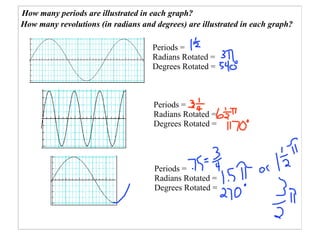
- 1. How many periods are illustrated in each graph? How many revolutions (in radians and degrees) are illustrated in each graph? Periods = Radians Rotated = Degrees Rotated = Periods = Radians Rotated = Degrees Rotated = Periods = Radians Rotated = Degrees Rotated =
- 2. State the amplitude, period, horizontal shift, and vertical shift for each of the following: amplitude: amplitude: period: period: horizontal shift: horizontal shift: vertical shift: vertical shift: amplitude: amplitude: period: period: horizontal shift: horizontal shift: vertical shift: vertical shift:
- 3. Determine approximate values for the parameters 'a', 'b', 'c', and 'd' from the graphs, and then write the equations of each graph as a sinusoidal function in the form: y = a sin b(x + c) + d
- 4. Enter the values into your calculator, and use a sinusoidal regression to determine the equation. Round the values of the parameters to one decimal place. x -1 -0.5 0 0.5 1 1.5 2 2.5 y1 -2.6 -5.6 -5.4 -2 1.4 1.6 -1.4
- 5. Jud was working with sinusoidal data, but lost all of it except for two points. A maximum point was (3, 13) and a minimum point next to it was (7, 1). Write a sinusoidal equation that matches Jud's data.