70:20:10 The Right Ratio, or So We All Thought - GLF 2014|2015
•
1 recomendación•1,031 vistas

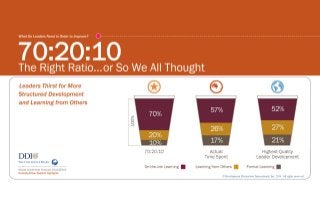
Is 70:20:10 fact or myth? We couldn't find any recent supporting research, and we wanted to learn more about these magic numbers. What we found might just surprise you: in reality, leaders spend their time on--and prefer--a different ratio. See how leaders actually spend their time, and the ratio that proves most effective. For a full list of findings from the Global Leadership Forecast 2014|2015, visit www.ddiworld.com/glf2014.

Recomendados
Recomendados
Más contenido relacionado
Más de DDI | Development Dimensions International
Más de DDI | Development Dimensions International (20)
Último
Último (20)
70:20:10 The Right Ratio, or So We All Thought - GLF 2014|2015
- 2. Get R Bump The most com ratio—70 repr and 10, learnin decades-old re value of learni a near-univers and receive de that they never These disconn research—pro test with over time leaders sp significantly em de-emphasizin identified a rat very little by le similar ratio of Next, we want highest-quality exceed their pe leaders themse strongly assoc leaders actuall spend on leade spend. Austral hours/month n development. additional lear much more tim From all these misrepresents organizations w themselves pre ratio—emphas integration. Al them so they c value. id of t per Sti mmon piece of w resents learning ng from formal esearch that ask ing types. It ha al planning edi evelopment. Ev r intended it to nects—along w ompted us to fin 13,000 of toda pend on learnin mphasizes form ng on-the-job le tio of 55:25:20 eader level. Au f 57:26:17. ted to know wh y leader develo eers in leadersh elves. The resu iated with high ly spend their ti ership developm lian and New Z now, but would When asked w rning hours, the me in formal le e data we concl leaders’ reality with the highes efer. Even mor sizes the separa llowing learnin can build on on * McCall, M.W the Old cker wisdom on how g that occurs on l development. ked leaders to lo s evolved to so ict, looking for ven the ratio’s o be used as the with not a single nd out if this ra ay’s leaders. As ng has a very d mal learning an earning. Surpri 0 of actual learn ustralian and N hat ratio is used opment. To do hip developme ulting data show h quality—a ra ime. We also a ment as well a Zealand leaders d prefer to spen where they wou e chart at right earning and lea luded that over y and doesn’t m st-quality deve re problematic, ation of learnin ng methods to c ne another unde W., Yost, P.R., McH -10 Leadership De Beyond 70-20- Global Leadership Henry, J.J., O’Conn evelopment. p Forecast 2014 | 2015 d w leaders learn n the job; 20, le . This ratio orig ook backward omething very rward to how l originators hav e prescriptive to e piece of supp atio is fact or m s the illustration different ratio, o nd learning fro isingly, leaders ning time spent New Zealand le n is the 70:20:1 earning from ot ginated in d at the retrospe different, how leaders should ve stated public ool it has becom portive recent myth when put t n at left shows one that om others while s across the glo t, a ratio that va eaders identified d by organizatio so, we isolated ent quality as v wed that a ratio atio that closely asked leaders h s how much tim s reported that nd 7.9 hours/m uld most prefer shows their po arning from oth rreliance on 70 match the pract elopment or wh , the 70:20:10 r ng methods rath compete rather ermines their im ons that provid d organizations iewed by the o of 52:27:21 is y matches how how much time me they’d like they spend 4.6 month on leader r spending thos ointed response hers. :20:10 tices of hat leaders ratio—in fact, her than their r than integratin mpact and thei nor, P., & Plunkett, , M. (2014, May), 2 0 thers; ective ever: seek cly me.* to the s, the e obe aries d a de the s that s e they to 6 rship se e: any ng ir No ow Wh 1. Th hough 70:20 le eaders genera pr roportion of t le earning. As su se equence com w with learning f o not place to ercentages. E omeone (a “m ogether the rig ctivities to me nd the busine While experien thers are key llocating mor uild foundatio an have wide matching up w references. rganizations s a vital comp stablishing a n-the-job lear ob experience ustained, wel 2. D pe so to ac an 3. W ot al bu ca m pr 4. O is es on jo su Pf Percent Mor or o Each Typ match reality d a greater on-the-job choose and ormal learnin y, g ght on ning requires er”) who can tion of learnin s of both lear put ng ners and learning ve blend, cons mal learning ompetencies efits while ers’ learning from sider to that n formal learn learning mix, nd foundatio undation ena y converted in behavior chan ning n for bles nto nge. aders Want ing Austra at :10 does not ally will spend heir time in o uch, carefully mponents of fo rom others. oo much weig Effective learn master blende ght combinat eet the needs ess. ntial learning a to an effectiv e time on for onal leader co -ranging bene well with leade benefit when onent of the framework a rning. This fou es to be easily l-supported b re Time Lea pe of Learn t ralia | New Zealan d