Global HNWI Population and Wealth Hit New Highs
•
20 likes•6,893 views

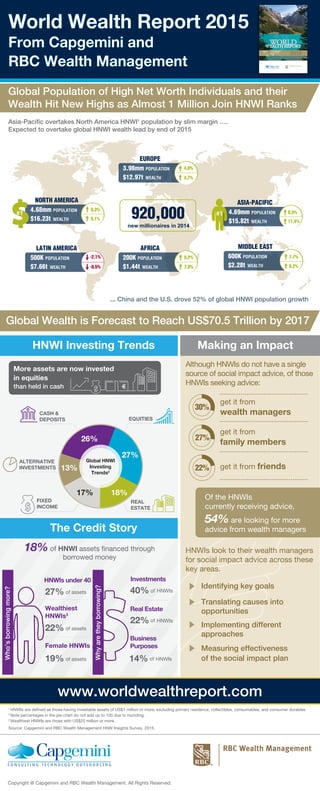
The World Wealth Report 2015 infographic explores the wealth, population and asset allocation of global high net worth individuals (HNWIs). The global population of high net worth individuals and their wealth hit new highs as almost 1 million joined HNWI ranks. Asia-Pacific overtook North America HNWI population by a slim margin and is expected to take the lead in global HNWI wealth by end of 2015. China and the U.S. drove 52% of global HNWI population growth. Learn more about the World Wealth Report 2015 from Capgemini and RBC Wealth Management at http://www.worldwealthreport.com.
Recommended

Recommended
More Related Content
What's hot
What's hot (20)
Viewers also liked
Viewers also liked (20)
Similar to Global HNWI Population and Wealth Hit New Highs
Similar to Global HNWI Population and Wealth Hit New Highs (20)
More from Capgemini
More from Capgemini (20)
Recently uploaded
Recently uploaded (20)
Global HNWI Population and Wealth Hit New Highs
- 1. Global Population of High Net Worth Individuals and their Wealth Hit New Highs as Almost 1 Million Join HNWI Ranks World Wealth Report 2015 From Capgemini and RBC Wealth Management 920,000 new millionaires in 2014 Asia-Pacific overtakes North America HNWI1 population by slim margin …. Expected to overtake global HNWI wealth lead by end of 2015 ... China and the U.S. drove 52% of global HNWI population growth CASH & DEPOSITS EQUITIES REAL ESTATE FIXED INCOME ALTERNATIVE INVESTMENTS 27% Global HNWI Investing Trends2 18%17% 26% 13% The Credit Story HNWI Investing Trends Although HNWIs do not have a single source of social impact advice, of those HNWIs seeking advice: Making an Impact www.worldwealthreport.com 1 HNWIs are defined as those having investable assets of US$1 million or more, excluding primary residence, collectibles, consumables, and consumer durables. 2 Note percentages in the pie chart do not add up to 100 due to rounding. 3 Wealthiest HNWIs are those with US$20 million or more. Source: Capgemini and RBC Wealth Management HNW Insights Survey, 2015. Copyright @ Capgemini and RBC Wealth Management. All Rights Reserved. HNWIs look to their wealth managers for social impact advice across these key areas. Global Wealth is Forecast to Reach US$70.5 Trillion by 2017 Who’sborrowingmore? Whyaretheyborrowing? 18% of HNWI assets financed through borrowed money 40% Investments ofof assets of assets More assets are now invested in equities than held in cash get it from wealth managers get it from family members get it from friends Identifying key goals Translating causes into opportunities Implementing different approaches Measuring effectiveness of the social impact plan Of the HNWIs currently receiving advice, 54% are looking for more advice from wealth managers HNWIs 22% Real Estate of HNWIs 14% of HNWIs Business Purposes 27% 22% HNWIs under 40 Wealthiest HNWIs3 of assets19% Female HNWIs EUROPE 3.98mm POPULATION $12.97t WEALTH 4.0% 4.7% NORTH AMERICA 4.68mm POPULATION $16.23t WEALTH 8.3% 9.1% #1 LATIN AMERICA 500K POPULATION $7.66t WEALTH -2.1% -0.5% AFRICA 200K POPULATION $1.44t WEALTH 5.2% 7.0% ASIA-PACIFIC 4.69mm POPULATION $15.82t WEALTH 8.5% 11.4% #1 MIDDLE EAST 600K POPULATION $2.28t WEALTH 7.7% 8.2% 30% 27% 22%