SlideShare una empresa de Scribd logo
1 de 4
Descargar para leer sin conexión
Job Absence & Turnover
2nd Quarter 2014
Job Absence Plummets in Second Quarter,
Falls Back to Typical Post-Recession Levels
In a pattern that has become familiar since the last re-
cession, signs of rising job absence in one quarter
vanished in the next. After reaching six-year highs in
early 2014, absence rates plunged back to typical post-
recession levels during the spring. Median monthly
rates of unscheduled absence (excluding long-term ab-
sences and partial days off) averaged 0.7 percent of
scheduled worker days in April, May and June, down
sharply from 1.0 percent in the first quarter of 2014 but
unchanged from the second-quarter average recorded a
year ago.
Employee absenteeism had climbed to its highest
points since 2008 in January (1.2 percent) and February
(1.1 percent) of this year, but the median monthly ab-
sence rate subsequently tumbled to 0.8 percent in
March and April and 0.7 percent in May and June. (See
the line graph below.)
Turnover Edges Up in the Second Quarter
but Still Tracks Below Pre-Recession Levels
Employee turnover in the spring outpaced separa-
tions in the previous quarter and the second quarter
of 2013, but departure rates remain well short of pre-
recession levels. Median rates of permanent separation
(excluding layoffs and reductions-in-force) averaged
0.9 percent of the workforce per month in the second
quarter, compared with 0.7 percent in the first quarter
and 0.8 percent in April to June of 2013.
As the line graph below shows, the median departure
rate climbed from 0.8 percent in March to 0.9 percent
in April and May, then fell back to 0.8 percent in June.
The April and May figures are each up two-tenths of
percentage point from 2013; the June rate is down
slightly from a year ago (0.9 percent). Separation rates
often rise as the weather grows warmer. Before the re-
cession, however, monthly turnover frequently surged
well above 1.0 percent in the spring and summer.
Monthly Job Absence Rates for All Employers
Median Percent of Scheduled Workdays
A BNA Graphic/suq314af
F M OA M J J A S N DJ
0
1
2
3
2013
2014
F M OA M J J A S N DJ
0
1
2
3
A BNA Graphic/suq314tf
Monthly Turnover Rates for All Employers
Median Percent of Workforce
2013
2014
VOL. 65, NO. 35 PART 2 PAGES S-1 - S-4 SEPTEMBER 2, 2014
COPYRIGHT ஽ 2014 BY THE BUREAU OF NATIONAL AFFAIRS, INC. ISSN 0525-2156
Bulletin to
Management™
Job Absence
Recent Patterns in Absence
Suggest Reemergence of Seasonal Trends
Through the first half of 2014, median monthly ab-
sence rates averaged 0.9 percent of scheduled
worker days, slightly higher than the mid-year averages
for 2013 (0.8 percent) and 2012 (0.7 percent) but still far
below levels that were common before the economic
downturn (e.g., an average of 1.4 percent over the first
six months of 2006).
In both 2013 and 2014, comparatively high job ab-
sence early in the year has been followed by much
lower absenteeism in the second quarter, suggesting
the reemergence of a seasonal pattern observed over
most of the survey’s history. Prior to the last recession
(late 2007 through mid-2009), absence typically de-
clined as winter gave way to spring, presumably a prod-
uct of better weather and the end of flu season. Since
the downturn, the severity of the recession and the
tenuous recovery might have prompted workers to
brave winter storms, ignore their symptoms, or both.
Absenteeism remains lowest among the smallest em-
ployers, as the bar chart at right shows. Median ab-
sence rates through the first half of the year averaged
0.6 percent of scheduled worker days among firms with
fewer than 250 workers, the same six-month average as
in 2013. Mid-year averages were substantially higher—
and up from a year earlier—among organizations with
250 to 499 workers (1.2 percent to 1.9 percent), 500 to
999 employees (0.6 percent to 0.9 percent), 1,000 to
2,499 workers (0.8 percent to 2.1 percent) and 2,500 or
more employees (1.5 percent to 1.7 percent).
Workers in nonmanufacturing firms are still less dis-
posed to taking an unscheduled day off than their col-
leagues in other industry sectors. Median absence rates
through the first half of 2014 averaged 0.6 percent of
scheduled worker days in the nonmanufacturing sector,
despite comparatively high job absence in the financial
sector (1.2 percent). As the bar chart at right shows, the
six-month average for 2014 was 1.0 percent among
manufacturing enterprises and 1.1 percent in both the
nonbusiness sector (e.g., hospitals, schools, govern-
ment) and its health care subgroup.
By region, the mid-year average was barely higher
among Southern and Western employers (1.0 percent
each) than in the Northeastern (0.9 percent) and North
Central (0.8 percent) regions.
Median Percent of Scheduled Workdays
Monthly Job Absence by Industry
201320122010 2011
0
1
2
3
Manufacturing
Nonbusiness
Nonmanufacturing
2014
A BNA Graphic/suq314al
Monthly Job Absence by Industry
Median Percent of Scheduled Workdays
Region
Northeast
South
North Central
West
All Employers
Average of Monthly Median Rates, in Percent
Unscheduled Absence: Jan.–Jun.
A BNA Graphic/suq314ab
Industry
Manufacturing
Nonmanufacturing
(Finance)
Nonbusiness
(Health Care)
Workforce Size
Fewer than 250
250-499
500-999
1,000-2,499
2,500 or more
1.9
1.7
2.1
0.9
0.6
1.0
0.6
1.1
0.8
1.1
0.9
1.2
0.9
1.0
1.0
S-2 (No. 35)
9-2-14 COPYRIGHT ஽ 2014 BY THE BUREAU OF NATIONAL AFFAIRS, INC. BTM ISSN 0525-2156
Turnover
Demographic Analysis Also Shows
No Consistent or Notable Trends
For the first six months of 2014, median monthly
separation rates averaged 0.8 percent of responding
employers’ workforces per month, marginally higher
than the mid-year average in 2013 (0.7 percent) and not
much different than attrition rates recorded over the
past several years. Turnover rates have rebounded only
slightly since plunging to record lows in 2009, with no
indication of a return to levels that were common be-
fore the last recession.
Demographic analysis also has borne out the lack of
sustained or consistent trends in employee separations.
Across workforce size classifications, the average of
median monthly separation rates through the first half
of the year edged up from 2013 among establishments
with 250 to 499 employees (from 0.8 percent to 0.9 per-
cent) and organizations with 500 to 999 workers (0.8
percent to 1.0 percent), but declined slightly among the
smallest responding companies (0.2 percent to 0.1 per-
cent) and more sharply in enterprises with 1,000 to
2,499 employees (1.2 percent to 0.9 percent). Among
the largest surveyed establishments (2,500 or more
workers), the six-month average was unchanged from a
year earlier, at 0.9 percent of those employers’ work-
forces per month.
By industry, the mid-year average of median
monthly attrition rates climbed from 0.7 percent to 0.9
percent among both manufacturing companies and
nonbusiness establishments (e.g., hospitals, schools,
municipalities). Turnover rose slightly among health
care facilities (1.1 percent to 1.2 percent) and continues
to outpace employee attrition in the nonbusiness sector
as a whole. (See the bar chart at right.) Those modest
increases were partially offset by a small decline in
separations in the nonmanufacturing sector, where the
six-month average of median separation rates fell from
0.7 percent to 0.6 percent of the workforce per month,
despite rising turnover among financial institutions (0.6
percent to 0.9 percent).
Employee attrition has exhibited even less variance
by geographic region. The six-month average of median
turnover rates climbed one-tenth of a point in the South
and West (to 0.9 percent in both regions), fell one-tenth
of a point among North Central employers (0.8 percent)
and held steady in the Northeast (at 0.6 percent).
20132012 20142010 2011
0
1
2
3
A BNA Graphic/suq314tl
Median Percent of Workforce
Monthly Turnover by Industry
Nonmanufacturing
Manufacturing
Nonbusiness
0.9
0.6
0.8
Average of Monthly Median Rates, in Percent
Monthly Turnover: Jan.–Jun.
A BNA Graphic/suq314tb
0.8
0.9
Workforce Size
Region
Fewer than 250
250-499
500-999
1,000-2,499
Northeast
South
North Central
West
All Employers
Industry
Manufacturing
Nonmanufacturing
(Finance)
Nonbusiness
(Health Care)
0.9
0.9
0.6
0.9
0.9
1.0
0.9
2,500 or more
1.2
0.1
0.9
(No. 35) S-3
BULLETIN TO MANAGEMENT ISSN 0525-2156 BNA 9-2-14
Table 1. Job Absence Rates
(days of absence as a percent of the average workforce)
April 2014 May 2014 June 2014
Low
1st
Quartile Median
3rd
Quartile High Low
1st
Quartile Median
3rd
Quartile High Low
1st
Quartile Median
3rd
Quartile High
All employers (87) 0.00 0.2 0.8 1.6 6.3 0.00 0.2 0.7 1.4 6.3 0.00 0.2 0.7 1.4 10.3
By Workforce Size
Fewer than 250 (57) 0.00 0.1 0.6 1.2 6.3 0.00 0.1 0.5 1.1 6.3 0.00 0.2 0.5 1.0 6.3
250-499 (8) 0.15 0.7 1.3 3.5 5.6 0.15 0.5 1.3 2.8 5.6 0.14 0.3 1.5 3.0 5.6
500-999 (10) 0.11 0.2 0.9 1.2 2.5 0.10 0.2 0.7 0.9 2.5 0.08 0.2 0.7 0.8 2.5
1000-2499 (3) 0.00 0.0 2.9 5.5 5.5 0.00 0.0 2.8 5.3 5.3 0.00 0.0 1.4 5.0 5.0
2500+ (9) 0.48 1.0 1.1 1.5 2.7 0.49 0.9 1.2 1.3 2.7 0.10 0.9 1.0 1.7 10.3
By Industry
Manufacturing (20) 0.00 0.5 0.9 1.3 5.6 0.00 0.5 1.0 1.3 5.6 0.00 0.2 0.7 1.5 5.6
Nonmfg (45) 0.00 0.1 0.4 1.2 4.8 0.00 0.1 0.4 1.0 4.8 0.00 0.1 0.3 1.0 4.9
Finance (7) 0.00 0.4 1.0 1.4 2.0 0.00 0.2 0.7 1.4 2.2 0.00 0.2 0.6 1.1 1.3
Nonbusiness (22) 0.00 0.6 1.3 2.0 6.3 0.00 0.5 1.0 1.8 6.3 0.00 0.5 0.9 2.0 10.3
Health Care (6) 0.55 0.9 1.6 1.7 2.9 0.50 0.9 1.3 1.7 2.8 0.43 0.9 1.4 1.7 2.0
By Region
Northeast (14) 0.00 0.3 0.9 1.2 3.1 0.00 0.4 0.7 1.3 3.5 0.00 0.4 0.7 1.4 3.0
South (35) 0.00 0.3 0.8 1.6 6.3 0.00 0.2 0.8 1.4 6.3 0.00 0.2 0.7 2.1 10.3
North Central (25) 0.00 0.2 0.9 1.5 5.6 0.00 0.2 0.8 1.3 5.6 0.00 0.2 0.6 1.3 5.6
West (13) 0.00 0.1 0.5 1.7 2.2 0.00 0.2 0.5 1.7 3.5 0.00 0.2 0.8 1.7 2.5
Number of worker-days lost through absence during month
Rates computed as: × 100
(Avg. no. of employees during month) × (No. of workdays)
Job absence is defined as unscheduled absence. It does not include long-term absences after the first four days; vacations, holidays or other scheduled
leave; or absences of less than a full day.
Table 2. Turnover Rates
(separations as a percent of the average workforce)
April 2014 May 2014 June 2014
Low
1st
Quartile Median
3rd
Quartile High Low
1st
Quartile Median
3rd
Quartile High Low
1st
Quartile Median
3rd
Quartile High
All employers (131) 0.00 0.0 0.9 1.6 10.7 0.00 0.0 0.9 1.7 11.6 0.00 0.0 0.8 1.5 11.8
By Workforce Size
Fewer than 250 (72) 0.00 0.0 0.0 1.8 10.7 0.00 0.0 0.0 1.7 11.6 0.00 0.0 0.6 2.1 11.8
250-499 (19) 0.00 0.7 1.1 1.6 5.8 0.30 0.6 1.1 1.8 9.1 0.00 0.6 0.9 1.3 5.1
500-999 (14) 0.34 0.6 1.3 1.7 3.8 0.34 0.6 1.2 1.9 3.8 0.00 0.4 1.2 2.1 4.2
1000-2499 (8) 0.38 0.6 0.9 1.0 1.1 0.36 0.6 1.0 1.4 2.7 0.36 0.6 0.8 1.0 2.1
2500+ (18) 0.00 0.6 0.8 1.1 3.8 0.00 0.5 0.9 1.6 4.7 0.00 0.4 0.9 1.2 7.2
By Industry
Manufacturing (31) 0.00 0.4 1.0 1.7 10.4 0.00 0.4 1.0 2.3 9.1 0.00 0.6 1.0 1.7 7.7
Nonmfg (64) 0.00 0.0 0.7 1.5 10.7 0.00 0.0 0.6 1.6 11.6 0.00 0.0 0.6 1.4 11.8
Finance (11) 0.00 0.7 1.1 1.7 10.0 0.00 0.0 1.3 1.7 2.7 0.00 0.0 0.8 2.1 11.1
Nonbusiness (36) 0.00 0.4 0.9 1.8 5.9 0.00 0.4 1.1 1.6 4.7 0.00 0.3 0.9 1.7 7.6
Health Care (13) 0.00 0.7 0.9 1.5 3.8 0.36 1.0 1.2 1.6 3.7 0.54 0.7 1.0 1.2 4.2
By Region
Northeast (25) 0.00 0.0 0.7 1.3 3.0 0.00 0.0 0.9 1.4 2.3 0.00 0.0 0.8 1.2 2.3
South (46) 0.00 0.0 0.9 1.6 10.4 0.00 0.3 1.0 1.8 6.3 0.00 0.0 0.9 2.0 9.1
North Central (39) 0.00 0.0 0.7 1.6 10.0 0.00 0.0 0.7 1.6 9.1 0.00 0.0 0.7 1.4 11.8
West (21) 0.00 0.8 1.1 2.0 10.7 0.00 0.0 1.0 2.7 11.6 0.00 0.0 1.0 2.1 7.7
Number of separations during month
Rates computed as: × 100
Avg. no. of employees on payroll during month
Turnover figures cover permanent separations, whether voluntary or involuntary. They do not include job eliminations, reductions-in-force, long-term leaves of
absence, layoffs or departures of temporary staff.
Note: Tables 1 and 2 show the range of absence and turnover rates reported for each month. Between the first and third quartiles fall half of the reported
rates; a fourth of the employers had rates below the first quartile, and a fourth had rates above the third quartile. The number of responding employers in
each category is indicated by the figures in parentheses.
The Survey Sample: This survey is conducted quarterly among a panel of human resource executives representing organizations throughout the United
States. Of the 154 employers responding in time for tabulation of this quarter’s survey, 54 percent have fewer than 250 workers, 13 percent have
workforces of 250 to 499 employees, 12 percent employ 500 to 999 workers, 6 percent have workforces of 1,000 to 2,499 employees and 15 percent
employ at least 2,500 workers. By industry, 23 percent of the organizations are manufacturing companies, 51 percent are nonmanufacturing firms and 25
percent are nonbusiness establishments. By region, 18 percent of the employers are located in the Northeast, 38 percent operate in the South, 27 percent
are located in North Central states and 18 percent operate in the West. Estimated total employment of the responding organizations: 635,962.
S-4 (No. 35)
9-2-14 COPYRIGHT ஽ 2014 BY THE BUREAU OF NATIONAL AFFAIRS, INC. BTM ISSN 0525-2156

Más contenido relacionado

Similar a Report on Job Absence & Turnover (2014 2nd Quarter)

20150209_AFPEconWatch-2
20150209_AFPEconWatch-220150209_AFPEconWatch-2
20150209_AFPEconWatch-2Kevin Roth
 
Economic update (may 2013)
Economic update (may 2013)Economic update (may 2013)
Economic update (may 2013)veredus
 
November 2016 U.S. employment update and outlook
November 2016 U.S. employment update and outlookNovember 2016 U.S. employment update and outlook
November 2016 U.S. employment update and outlookJLL
 
September 2016 U.S. employment update and outlook
September 2016 U.S. employment update and outlookSeptember 2016 U.S. employment update and outlook
September 2016 U.S. employment update and outlookJLL
 
Economic Update- March 2015
Economic Update- March 2015Economic Update- March 2015
Economic Update- March 2015Laci Phillips
 
March 2016 U.S. employment update and outlook
March 2016 U.S. employment update and outlookMarch 2016 U.S. employment update and outlook
March 2016 U.S. employment update and outlookJLL
 
US employment rate data and trends – December 2016
US employment rate data and trends – December 2016 US employment rate data and trends – December 2016
US employment rate data and trends – December 2016 JLL
 
June Jobs Report - U.S. Department of the Treasury
June Jobs Report - U.S. Department of the TreasuryJune Jobs Report - U.S. Department of the Treasury
June Jobs Report - U.S. Department of the Treasurybusinessforward
 
Minneapolis–St. Employment Update | November 2015
Minneapolis–St. Employment Update | November 2015Minneapolis–St. Employment Update | November 2015
Minneapolis–St. Employment Update | November 2015Carolyn Bates
 
U.S. employment update and outlook: October 2014
U.S. employment update and outlook: October 2014U.S. employment update and outlook: October 2014
U.S. employment update and outlook: October 2014JLL
 
Lehigh Valley Outlook - June
Lehigh Valley Outlook - JuneLehigh Valley Outlook - June
Lehigh Valley Outlook - JuneDon Stewart
 
Minneapolis–St. Employment Update | December 2015
Minneapolis–St. Employment Update | December 2015Minneapolis–St. Employment Update | December 2015
Minneapolis–St. Employment Update | December 2015Carolyn Bates
 
October regional snapshot economy 2016
October regional snapshot economy 2016October regional snapshot economy 2016
October regional snapshot economy 2016ARCResearch
 
November 2015 U.S. employment update and outlook
November 2015 U.S. employment update and outlookNovember 2015 U.S. employment update and outlook
November 2015 U.S. employment update and outlookJLL
 
February 2016 U.S. employment update and outlook
February 2016 U.S. employment update and outlook February 2016 U.S. employment update and outlook
February 2016 U.S. employment update and outlook JLL
 
US Talent Market Monthly August 2013
US Talent Market Monthly August 2013US Talent Market Monthly August 2013
US Talent Market Monthly August 2013Kelly Services
 
Why 2014 hasn’t been the year of the pay rise
Why 2014 hasn’t been the year of the pay riseWhy 2014 hasn’t been the year of the pay rise
Why 2014 hasn’t been the year of the pay riseResolutionFoundation
 
October 2016 U.S. employment update and outlook
October 2016 U.S. employment update and outlookOctober 2016 U.S. employment update and outlook
October 2016 U.S. employment update and outlookJLL
 
December 2015 U.S. employment update and outlook
December 2015 U.S. employment update and outlookDecember 2015 U.S. employment update and outlook
December 2015 U.S. employment update and outlookJLL
 

Similar a Report on Job Absence & Turnover (2014 2nd Quarter) (20)

20150209_AFPEconWatch-2
20150209_AFPEconWatch-220150209_AFPEconWatch-2
20150209_AFPEconWatch-2
 
Economic update (may 2013)
Economic update (may 2013)Economic update (may 2013)
Economic update (may 2013)
 
November 2016 U.S. employment update and outlook
November 2016 U.S. employment update and outlookNovember 2016 U.S. employment update and outlook
November 2016 U.S. employment update and outlook
 
September 2016 U.S. employment update and outlook
September 2016 U.S. employment update and outlookSeptember 2016 U.S. employment update and outlook
September 2016 U.S. employment update and outlook
 
Economic Update- March 2015
Economic Update- March 2015Economic Update- March 2015
Economic Update- March 2015
 
March 2016 U.S. employment update and outlook
March 2016 U.S. employment update and outlookMarch 2016 U.S. employment update and outlook
March 2016 U.S. employment update and outlook
 
US employment rate data and trends – December 2016
US employment rate data and trends – December 2016 US employment rate data and trends – December 2016
US employment rate data and trends – December 2016
 
June Jobs Report - U.S. Department of the Treasury
June Jobs Report - U.S. Department of the TreasuryJune Jobs Report - U.S. Department of the Treasury
June Jobs Report - U.S. Department of the Treasury
 
Minneapolis–St. Employment Update | November 2015
Minneapolis–St. Employment Update | November 2015Minneapolis–St. Employment Update | November 2015
Minneapolis–St. Employment Update | November 2015
 
U.S. employment update and outlook: October 2014
U.S. employment update and outlook: October 2014U.S. employment update and outlook: October 2014
U.S. employment update and outlook: October 2014
 
Lehigh Valley Outlook - June
Lehigh Valley Outlook - JuneLehigh Valley Outlook - June
Lehigh Valley Outlook - June
 
Minneapolis–St. Employment Update | December 2015
Minneapolis–St. Employment Update | December 2015Minneapolis–St. Employment Update | December 2015
Minneapolis–St. Employment Update | December 2015
 
October regional snapshot economy 2016
October regional snapshot economy 2016October regional snapshot economy 2016
October regional snapshot economy 2016
 
November 2015 U.S. employment update and outlook
November 2015 U.S. employment update and outlookNovember 2015 U.S. employment update and outlook
November 2015 U.S. employment update and outlook
 
February 2016 U.S. employment update and outlook
February 2016 U.S. employment update and outlook February 2016 U.S. employment update and outlook
February 2016 U.S. employment update and outlook
 
US Talent Market Monthly August 2013
US Talent Market Monthly August 2013US Talent Market Monthly August 2013
US Talent Market Monthly August 2013
 
Why 2014 hasn’t been the year of the pay rise
Why 2014 hasn’t been the year of the pay riseWhy 2014 hasn’t been the year of the pay rise
Why 2014 hasn’t been the year of the pay rise
 
Full slide-pack-final
Full slide-pack-finalFull slide-pack-final
Full slide-pack-final
 
October 2016 U.S. employment update and outlook
October 2016 U.S. employment update and outlookOctober 2016 U.S. employment update and outlook
October 2016 U.S. employment update and outlook
 
December 2015 U.S. employment update and outlook
December 2015 U.S. employment update and outlookDecember 2015 U.S. employment update and outlook
December 2015 U.S. employment update and outlook
 

Más de Sage HR

Remote Working in a Crisis: A Workplace Toolkit [White Paper]
Remote Working in a Crisis: A Workplace Toolkit [White Paper]Remote Working in a Crisis: A Workplace Toolkit [White Paper]
Remote Working in a Crisis: A Workplace Toolkit [White Paper]Sage HR
 
HR for Small Businesses
HR for Small BusinessesHR for Small Businesses
HR for Small BusinessesSage HR
 
Human Resources Gurus for Q2 2019: CakeHR’s A-Z HR Experts List for the Secon...
Human Resources Gurus for Q2 2019: CakeHR’s A-Z HR Experts List for the Secon...Human Resources Gurus for Q2 2019: CakeHR’s A-Z HR Experts List for the Secon...
Human Resources Gurus for Q2 2019: CakeHR’s A-Z HR Experts List for the Secon...Sage HR
 
HR Gurus for Q1 2019: The A-Z of Human Resources Experts This Quarter [Infogr...
HR Gurus for Q1 2019: The A-Z of Human Resources Experts This Quarter [Infogr...HR Gurus for Q1 2019: The A-Z of Human Resources Experts This Quarter [Infogr...
HR Gurus for Q1 2019: The A-Z of Human Resources Experts This Quarter [Infogr...Sage HR
 
A-Z HR Gurus of Q4 2018: See the Current Experts in Human Resources!
A-Z HR Gurus of Q4 2018: See the Current Experts in Human Resources!A-Z HR Gurus of Q4 2018: See the Current Experts in Human Resources!
A-Z HR Gurus of Q4 2018: See the Current Experts in Human Resources!Sage HR
 
CakeHR Pitch Deck for Zīmolu Tops - Latvia's Most Beloved Startup Brands.
CakeHR Pitch Deck for Zīmolu Tops - Latvia's Most Beloved Startup Brands.CakeHR Pitch Deck for Zīmolu Tops - Latvia's Most Beloved Startup Brands.
CakeHR Pitch Deck for Zīmolu Tops - Latvia's Most Beloved Startup Brands.Sage HR
 
CakeHR’s A-Z HR Gurus for Q2 2018: Current Experts in Human Resources [Infogr...
CakeHR’s A-Z HR Gurus for Q2 2018: Current Experts in Human Resources [Infogr...CakeHR’s A-Z HR Gurus for Q2 2018: Current Experts in Human Resources [Infogr...
CakeHR’s A-Z HR Gurus for Q2 2018: Current Experts in Human Resources [Infogr...Sage HR
 
HR Experts for Q12018: See the Gurus Who Made This Quarter’s List!
HR Experts for Q12018: See the Gurus Who Made This Quarter’s List!HR Experts for Q12018: See the Gurus Who Made This Quarter’s List!
HR Experts for Q12018: See the Gurus Who Made This Quarter’s List!Sage HR
 
GDPR - are you ready for the challenge?
GDPR - are you ready for the challenge?GDPR - are you ready for the challenge?
GDPR - are you ready for the challenge?Sage HR
 
Introducing you to the top 112 HR Analytics experts [infographic]
Introducing you to the top 112 HR Analytics experts [infographic]Introducing you to the top 112 HR Analytics experts [infographic]
Introducing you to the top 112 HR Analytics experts [infographic]Sage HR
 
HR Gurus A-Z List: Revisiting the Current Industry Experts for Q4 2017
HR Gurus A-Z List: Revisiting the Current Industry Experts for Q4 2017HR Gurus A-Z List: Revisiting the Current Industry Experts for Q4 2017
HR Gurus A-Z List: Revisiting the Current Industry Experts for Q4 2017Sage HR
 
Human Resource’s Gurus: Picking HR’s Ultimate A-Z Team | Q3 2017
Human Resource’s Gurus: Picking HR’s Ultimate A-Z Team | Q3 2017Human Resource’s Gurus: Picking HR’s Ultimate A-Z Team | Q3 2017
Human Resource’s Gurus: Picking HR’s Ultimate A-Z Team | Q3 2017Sage HR
 
Defining Your Employee Value Proposition. 34 Surprisingly Useful Questions to...
Defining Your Employee Value Proposition. 34 Surprisingly Useful Questions to...Defining Your Employee Value Proposition. 34 Surprisingly Useful Questions to...
Defining Your Employee Value Proposition. 34 Surprisingly Useful Questions to...Sage HR
 
Introduction to the HR management software CakeHR
Introduction to the HR management software CakeHRIntroduction to the HR management software CakeHR
Introduction to the HR management software CakeHRSage HR
 
Technology in HR - Human Resources Management Software
Technology in HR - Human Resources Management SoftwareTechnology in HR - Human Resources Management Software
Technology in HR - Human Resources Management SoftwareSage HR
 
5 Reasons Why Holacracy is Failing. Is it Time to Say Goodbye to Holacracy (a...
5 Reasons Why Holacracy is Failing. Is it Time to Say Goodbye to Holacracy (a...5 Reasons Why Holacracy is Failing. Is it Time to Say Goodbye to Holacracy (a...
5 Reasons Why Holacracy is Failing. Is it Time to Say Goodbye to Holacracy (a...Sage HR
 
10 Easy Ways to Unleash Your Kid's Brain Power
10 Easy Ways to Unleash Your Kid's Brain Power10 Easy Ways to Unleash Your Kid's Brain Power
10 Easy Ways to Unleash Your Kid's Brain PowerSage HR
 
How to Skyrocket Your Communication Skills - 23 Awesome Tips!
How to Skyrocket Your Communication Skills - 23 Awesome Tips!How to Skyrocket Your Communication Skills - 23 Awesome Tips!
How to Skyrocket Your Communication Skills - 23 Awesome Tips!Sage HR
 
The Power of Employee Appreciation. 5 Best Practices in Employee Recognition.
The Power of Employee Appreciation. 5 Best Practices in Employee Recognition.The Power of Employee Appreciation. 5 Best Practices in Employee Recognition.
The Power of Employee Appreciation. 5 Best Practices in Employee Recognition.Sage HR
 
How Volkswagen Mocked Corporate Social Responsibility: “Diesel Gate” Outs Sus...
How Volkswagen Mocked Corporate Social Responsibility: “Diesel Gate” Outs Sus...How Volkswagen Mocked Corporate Social Responsibility: “Diesel Gate” Outs Sus...
How Volkswagen Mocked Corporate Social Responsibility: “Diesel Gate” Outs Sus...Sage HR
 

Más de Sage HR (20)

Remote Working in a Crisis: A Workplace Toolkit [White Paper]
Remote Working in a Crisis: A Workplace Toolkit [White Paper]Remote Working in a Crisis: A Workplace Toolkit [White Paper]
Remote Working in a Crisis: A Workplace Toolkit [White Paper]
 
HR for Small Businesses
HR for Small BusinessesHR for Small Businesses
HR for Small Businesses
 
Human Resources Gurus for Q2 2019: CakeHR’s A-Z HR Experts List for the Secon...
Human Resources Gurus for Q2 2019: CakeHR’s A-Z HR Experts List for the Secon...Human Resources Gurus for Q2 2019: CakeHR’s A-Z HR Experts List for the Secon...
Human Resources Gurus for Q2 2019: CakeHR’s A-Z HR Experts List for the Secon...
 
HR Gurus for Q1 2019: The A-Z of Human Resources Experts This Quarter [Infogr...
HR Gurus for Q1 2019: The A-Z of Human Resources Experts This Quarter [Infogr...HR Gurus for Q1 2019: The A-Z of Human Resources Experts This Quarter [Infogr...
HR Gurus for Q1 2019: The A-Z of Human Resources Experts This Quarter [Infogr...
 
A-Z HR Gurus of Q4 2018: See the Current Experts in Human Resources!
A-Z HR Gurus of Q4 2018: See the Current Experts in Human Resources!A-Z HR Gurus of Q4 2018: See the Current Experts in Human Resources!
A-Z HR Gurus of Q4 2018: See the Current Experts in Human Resources!
 
CakeHR Pitch Deck for Zīmolu Tops - Latvia's Most Beloved Startup Brands.
CakeHR Pitch Deck for Zīmolu Tops - Latvia's Most Beloved Startup Brands.CakeHR Pitch Deck for Zīmolu Tops - Latvia's Most Beloved Startup Brands.
CakeHR Pitch Deck for Zīmolu Tops - Latvia's Most Beloved Startup Brands.
 
CakeHR’s A-Z HR Gurus for Q2 2018: Current Experts in Human Resources [Infogr...
CakeHR’s A-Z HR Gurus for Q2 2018: Current Experts in Human Resources [Infogr...CakeHR’s A-Z HR Gurus for Q2 2018: Current Experts in Human Resources [Infogr...
CakeHR’s A-Z HR Gurus for Q2 2018: Current Experts in Human Resources [Infogr...
 
HR Experts for Q12018: See the Gurus Who Made This Quarter’s List!
HR Experts for Q12018: See the Gurus Who Made This Quarter’s List!HR Experts for Q12018: See the Gurus Who Made This Quarter’s List!
HR Experts for Q12018: See the Gurus Who Made This Quarter’s List!
 
GDPR - are you ready for the challenge?
GDPR - are you ready for the challenge?GDPR - are you ready for the challenge?
GDPR - are you ready for the challenge?
 
Introducing you to the top 112 HR Analytics experts [infographic]
Introducing you to the top 112 HR Analytics experts [infographic]Introducing you to the top 112 HR Analytics experts [infographic]
Introducing you to the top 112 HR Analytics experts [infographic]
 
HR Gurus A-Z List: Revisiting the Current Industry Experts for Q4 2017
HR Gurus A-Z List: Revisiting the Current Industry Experts for Q4 2017HR Gurus A-Z List: Revisiting the Current Industry Experts for Q4 2017
HR Gurus A-Z List: Revisiting the Current Industry Experts for Q4 2017
 
Human Resource’s Gurus: Picking HR’s Ultimate A-Z Team | Q3 2017
Human Resource’s Gurus: Picking HR’s Ultimate A-Z Team | Q3 2017Human Resource’s Gurus: Picking HR’s Ultimate A-Z Team | Q3 2017
Human Resource’s Gurus: Picking HR’s Ultimate A-Z Team | Q3 2017
 
Defining Your Employee Value Proposition. 34 Surprisingly Useful Questions to...
Defining Your Employee Value Proposition. 34 Surprisingly Useful Questions to...Defining Your Employee Value Proposition. 34 Surprisingly Useful Questions to...
Defining Your Employee Value Proposition. 34 Surprisingly Useful Questions to...
 
Introduction to the HR management software CakeHR
Introduction to the HR management software CakeHRIntroduction to the HR management software CakeHR
Introduction to the HR management software CakeHR
 
Technology in HR - Human Resources Management Software
Technology in HR - Human Resources Management SoftwareTechnology in HR - Human Resources Management Software
Technology in HR - Human Resources Management Software
 
5 Reasons Why Holacracy is Failing. Is it Time to Say Goodbye to Holacracy (a...
5 Reasons Why Holacracy is Failing. Is it Time to Say Goodbye to Holacracy (a...5 Reasons Why Holacracy is Failing. Is it Time to Say Goodbye to Holacracy (a...
5 Reasons Why Holacracy is Failing. Is it Time to Say Goodbye to Holacracy (a...
 
10 Easy Ways to Unleash Your Kid's Brain Power
10 Easy Ways to Unleash Your Kid's Brain Power10 Easy Ways to Unleash Your Kid's Brain Power
10 Easy Ways to Unleash Your Kid's Brain Power
 
How to Skyrocket Your Communication Skills - 23 Awesome Tips!
How to Skyrocket Your Communication Skills - 23 Awesome Tips!How to Skyrocket Your Communication Skills - 23 Awesome Tips!
How to Skyrocket Your Communication Skills - 23 Awesome Tips!
 
The Power of Employee Appreciation. 5 Best Practices in Employee Recognition.
The Power of Employee Appreciation. 5 Best Practices in Employee Recognition.The Power of Employee Appreciation. 5 Best Practices in Employee Recognition.
The Power of Employee Appreciation. 5 Best Practices in Employee Recognition.
 
How Volkswagen Mocked Corporate Social Responsibility: “Diesel Gate” Outs Sus...
How Volkswagen Mocked Corporate Social Responsibility: “Diesel Gate” Outs Sus...How Volkswagen Mocked Corporate Social Responsibility: “Diesel Gate” Outs Sus...
How Volkswagen Mocked Corporate Social Responsibility: “Diesel Gate” Outs Sus...
 

Último

The No-Nonsense Guide to Choosing the Right Human Resources Management Softwa...
The No-Nonsense Guide to Choosing the Right Human Resources Management Softwa...The No-Nonsense Guide to Choosing the Right Human Resources Management Softwa...
The No-Nonsense Guide to Choosing the Right Human Resources Management Softwa...HRMantra Software Pvt. Ltd
 
Market Signals – Global Job Market Trends – March 2024 summarized!
Market Signals – Global Job Market Trends – March 2024 summarized!Market Signals – Global Job Market Trends – March 2024 summarized!
Market Signals – Global Job Market Trends – March 2024 summarized!Career Angels
 
The Engagement Engine: Strategies for Building a High-Performance Culture
The Engagement Engine: Strategies for Building a High-Performance CultureThe Engagement Engine: Strategies for Building a High-Performance Culture
The Engagement Engine: Strategies for Building a High-Performance CultureAggregage
 
Salary Survey 2024 For Employers to Hire Remotely From India
Salary Survey 2024 For Employers to Hire Remotely From IndiaSalary Survey 2024 For Employers to Hire Remotely From India
Salary Survey 2024 For Employers to Hire Remotely From IndiaNayantikaSrivastava1
 
Webinar - Q2 2024: What’s New in MarketPay
Webinar - Q2 2024: What’s New in MarketPayWebinar - Q2 2024: What’s New in MarketPay
Webinar - Q2 2024: What’s New in MarketPayPayScale, Inc.
 
Presentation on HR for Weekly Review Meeting
Presentation on HR for Weekly Review MeetingPresentation on HR for Weekly Review Meeting
Presentation on HR for Weekly Review MeetingAlokChatterjee16
 

Último (6)

The No-Nonsense Guide to Choosing the Right Human Resources Management Softwa...
The No-Nonsense Guide to Choosing the Right Human Resources Management Softwa...The No-Nonsense Guide to Choosing the Right Human Resources Management Softwa...
The No-Nonsense Guide to Choosing the Right Human Resources Management Softwa...
 
Market Signals – Global Job Market Trends – March 2024 summarized!
Market Signals – Global Job Market Trends – March 2024 summarized!Market Signals – Global Job Market Trends – March 2024 summarized!
Market Signals – Global Job Market Trends – March 2024 summarized!
 
The Engagement Engine: Strategies for Building a High-Performance Culture
The Engagement Engine: Strategies for Building a High-Performance CultureThe Engagement Engine: Strategies for Building a High-Performance Culture
The Engagement Engine: Strategies for Building a High-Performance Culture
 
Salary Survey 2024 For Employers to Hire Remotely From India
Salary Survey 2024 For Employers to Hire Remotely From IndiaSalary Survey 2024 For Employers to Hire Remotely From India
Salary Survey 2024 For Employers to Hire Remotely From India
 
Webinar - Q2 2024: What’s New in MarketPay
Webinar - Q2 2024: What’s New in MarketPayWebinar - Q2 2024: What’s New in MarketPay
Webinar - Q2 2024: What’s New in MarketPay
 
Presentation on HR for Weekly Review Meeting
Presentation on HR for Weekly Review MeetingPresentation on HR for Weekly Review Meeting
Presentation on HR for Weekly Review Meeting
 

Report on Job Absence & Turnover (2014 2nd Quarter)

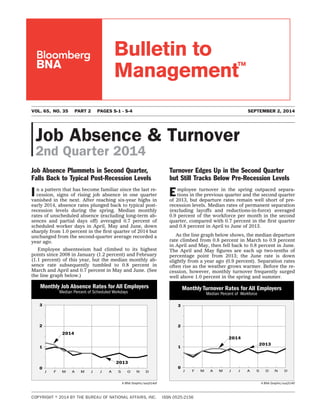
  • 1. Job Absence & Turnover 2nd Quarter 2014 Job Absence Plummets in Second Quarter, Falls Back to Typical Post-Recession Levels In a pattern that has become familiar since the last re- cession, signs of rising job absence in one quarter vanished in the next. After reaching six-year highs in early 2014, absence rates plunged back to typical post- recession levels during the spring. Median monthly rates of unscheduled absence (excluding long-term ab- sences and partial days off) averaged 0.7 percent of scheduled worker days in April, May and June, down sharply from 1.0 percent in the first quarter of 2014 but unchanged from the second-quarter average recorded a year ago. Employee absenteeism had climbed to its highest points since 2008 in January (1.2 percent) and February (1.1 percent) of this year, but the median monthly ab- sence rate subsequently tumbled to 0.8 percent in March and April and 0.7 percent in May and June. (See the line graph below.) Turnover Edges Up in the Second Quarter but Still Tracks Below Pre-Recession Levels Employee turnover in the spring outpaced separa- tions in the previous quarter and the second quarter of 2013, but departure rates remain well short of pre- recession levels. Median rates of permanent separation (excluding layoffs and reductions-in-force) averaged 0.9 percent of the workforce per month in the second quarter, compared with 0.7 percent in the first quarter and 0.8 percent in April to June of 2013. As the line graph below shows, the median departure rate climbed from 0.8 percent in March to 0.9 percent in April and May, then fell back to 0.8 percent in June. The April and May figures are each up two-tenths of percentage point from 2013; the June rate is down slightly from a year ago (0.9 percent). Separation rates often rise as the weather grows warmer. Before the re- cession, however, monthly turnover frequently surged well above 1.0 percent in the spring and summer. Monthly Job Absence Rates for All Employers Median Percent of Scheduled Workdays A BNA Graphic/suq314af F M OA M J J A S N DJ 0 1 2 3 2013 2014 F M OA M J J A S N DJ 0 1 2 3 A BNA Graphic/suq314tf Monthly Turnover Rates for All Employers Median Percent of Workforce 2013 2014 VOL. 65, NO. 35 PART 2 PAGES S-1 - S-4 SEPTEMBER 2, 2014 COPYRIGHT ஽ 2014 BY THE BUREAU OF NATIONAL AFFAIRS, INC. ISSN 0525-2156 Bulletin to Management™
  • 2. Job Absence Recent Patterns in Absence Suggest Reemergence of Seasonal Trends Through the first half of 2014, median monthly ab- sence rates averaged 0.9 percent of scheduled worker days, slightly higher than the mid-year averages for 2013 (0.8 percent) and 2012 (0.7 percent) but still far below levels that were common before the economic downturn (e.g., an average of 1.4 percent over the first six months of 2006). In both 2013 and 2014, comparatively high job ab- sence early in the year has been followed by much lower absenteeism in the second quarter, suggesting the reemergence of a seasonal pattern observed over most of the survey’s history. Prior to the last recession (late 2007 through mid-2009), absence typically de- clined as winter gave way to spring, presumably a prod- uct of better weather and the end of flu season. Since the downturn, the severity of the recession and the tenuous recovery might have prompted workers to brave winter storms, ignore their symptoms, or both. Absenteeism remains lowest among the smallest em- ployers, as the bar chart at right shows. Median ab- sence rates through the first half of the year averaged 0.6 percent of scheduled worker days among firms with fewer than 250 workers, the same six-month average as in 2013. Mid-year averages were substantially higher— and up from a year earlier—among organizations with 250 to 499 workers (1.2 percent to 1.9 percent), 500 to 999 employees (0.6 percent to 0.9 percent), 1,000 to 2,499 workers (0.8 percent to 2.1 percent) and 2,500 or more employees (1.5 percent to 1.7 percent). Workers in nonmanufacturing firms are still less dis- posed to taking an unscheduled day off than their col- leagues in other industry sectors. Median absence rates through the first half of 2014 averaged 0.6 percent of scheduled worker days in the nonmanufacturing sector, despite comparatively high job absence in the financial sector (1.2 percent). As the bar chart at right shows, the six-month average for 2014 was 1.0 percent among manufacturing enterprises and 1.1 percent in both the nonbusiness sector (e.g., hospitals, schools, govern- ment) and its health care subgroup. By region, the mid-year average was barely higher among Southern and Western employers (1.0 percent each) than in the Northeastern (0.9 percent) and North Central (0.8 percent) regions. Median Percent of Scheduled Workdays Monthly Job Absence by Industry 201320122010 2011 0 1 2 3 Manufacturing Nonbusiness Nonmanufacturing 2014 A BNA Graphic/suq314al Monthly Job Absence by Industry Median Percent of Scheduled Workdays Region Northeast South North Central West All Employers Average of Monthly Median Rates, in Percent Unscheduled Absence: Jan.–Jun. A BNA Graphic/suq314ab Industry Manufacturing Nonmanufacturing (Finance) Nonbusiness (Health Care) Workforce Size Fewer than 250 250-499 500-999 1,000-2,499 2,500 or more 1.9 1.7 2.1 0.9 0.6 1.0 0.6 1.1 0.8 1.1 0.9 1.2 0.9 1.0 1.0 S-2 (No. 35) 9-2-14 COPYRIGHT ஽ 2014 BY THE BUREAU OF NATIONAL AFFAIRS, INC. BTM ISSN 0525-2156
  • 3. Turnover Demographic Analysis Also Shows No Consistent or Notable Trends For the first six months of 2014, median monthly separation rates averaged 0.8 percent of responding employers’ workforces per month, marginally higher than the mid-year average in 2013 (0.7 percent) and not much different than attrition rates recorded over the past several years. Turnover rates have rebounded only slightly since plunging to record lows in 2009, with no indication of a return to levels that were common be- fore the last recession. Demographic analysis also has borne out the lack of sustained or consistent trends in employee separations. Across workforce size classifications, the average of median monthly separation rates through the first half of the year edged up from 2013 among establishments with 250 to 499 employees (from 0.8 percent to 0.9 per- cent) and organizations with 500 to 999 workers (0.8 percent to 1.0 percent), but declined slightly among the smallest responding companies (0.2 percent to 0.1 per- cent) and more sharply in enterprises with 1,000 to 2,499 employees (1.2 percent to 0.9 percent). Among the largest surveyed establishments (2,500 or more workers), the six-month average was unchanged from a year earlier, at 0.9 percent of those employers’ work- forces per month. By industry, the mid-year average of median monthly attrition rates climbed from 0.7 percent to 0.9 percent among both manufacturing companies and nonbusiness establishments (e.g., hospitals, schools, municipalities). Turnover rose slightly among health care facilities (1.1 percent to 1.2 percent) and continues to outpace employee attrition in the nonbusiness sector as a whole. (See the bar chart at right.) Those modest increases were partially offset by a small decline in separations in the nonmanufacturing sector, where the six-month average of median separation rates fell from 0.7 percent to 0.6 percent of the workforce per month, despite rising turnover among financial institutions (0.6 percent to 0.9 percent). Employee attrition has exhibited even less variance by geographic region. The six-month average of median turnover rates climbed one-tenth of a point in the South and West (to 0.9 percent in both regions), fell one-tenth of a point among North Central employers (0.8 percent) and held steady in the Northeast (at 0.6 percent). 20132012 20142010 2011 0 1 2 3 A BNA Graphic/suq314tl Median Percent of Workforce Monthly Turnover by Industry Nonmanufacturing Manufacturing Nonbusiness 0.9 0.6 0.8 Average of Monthly Median Rates, in Percent Monthly Turnover: Jan.–Jun. A BNA Graphic/suq314tb 0.8 0.9 Workforce Size Region Fewer than 250 250-499 500-999 1,000-2,499 Northeast South North Central West All Employers Industry Manufacturing Nonmanufacturing (Finance) Nonbusiness (Health Care) 0.9 0.9 0.6 0.9 0.9 1.0 0.9 2,500 or more 1.2 0.1 0.9 (No. 35) S-3 BULLETIN TO MANAGEMENT ISSN 0525-2156 BNA 9-2-14
  • 4. Table 1. Job Absence Rates (days of absence as a percent of the average workforce) April 2014 May 2014 June 2014 Low 1st Quartile Median 3rd Quartile High Low 1st Quartile Median 3rd Quartile High Low 1st Quartile Median 3rd Quartile High All employers (87) 0.00 0.2 0.8 1.6 6.3 0.00 0.2 0.7 1.4 6.3 0.00 0.2 0.7 1.4 10.3 By Workforce Size Fewer than 250 (57) 0.00 0.1 0.6 1.2 6.3 0.00 0.1 0.5 1.1 6.3 0.00 0.2 0.5 1.0 6.3 250-499 (8) 0.15 0.7 1.3 3.5 5.6 0.15 0.5 1.3 2.8 5.6 0.14 0.3 1.5 3.0 5.6 500-999 (10) 0.11 0.2 0.9 1.2 2.5 0.10 0.2 0.7 0.9 2.5 0.08 0.2 0.7 0.8 2.5 1000-2499 (3) 0.00 0.0 2.9 5.5 5.5 0.00 0.0 2.8 5.3 5.3 0.00 0.0 1.4 5.0 5.0 2500+ (9) 0.48 1.0 1.1 1.5 2.7 0.49 0.9 1.2 1.3 2.7 0.10 0.9 1.0 1.7 10.3 By Industry Manufacturing (20) 0.00 0.5 0.9 1.3 5.6 0.00 0.5 1.0 1.3 5.6 0.00 0.2 0.7 1.5 5.6 Nonmfg (45) 0.00 0.1 0.4 1.2 4.8 0.00 0.1 0.4 1.0 4.8 0.00 0.1 0.3 1.0 4.9 Finance (7) 0.00 0.4 1.0 1.4 2.0 0.00 0.2 0.7 1.4 2.2 0.00 0.2 0.6 1.1 1.3 Nonbusiness (22) 0.00 0.6 1.3 2.0 6.3 0.00 0.5 1.0 1.8 6.3 0.00 0.5 0.9 2.0 10.3 Health Care (6) 0.55 0.9 1.6 1.7 2.9 0.50 0.9 1.3 1.7 2.8 0.43 0.9 1.4 1.7 2.0 By Region Northeast (14) 0.00 0.3 0.9 1.2 3.1 0.00 0.4 0.7 1.3 3.5 0.00 0.4 0.7 1.4 3.0 South (35) 0.00 0.3 0.8 1.6 6.3 0.00 0.2 0.8 1.4 6.3 0.00 0.2 0.7 2.1 10.3 North Central (25) 0.00 0.2 0.9 1.5 5.6 0.00 0.2 0.8 1.3 5.6 0.00 0.2 0.6 1.3 5.6 West (13) 0.00 0.1 0.5 1.7 2.2 0.00 0.2 0.5 1.7 3.5 0.00 0.2 0.8 1.7 2.5 Number of worker-days lost through absence during month Rates computed as: × 100 (Avg. no. of employees during month) × (No. of workdays) Job absence is defined as unscheduled absence. It does not include long-term absences after the first four days; vacations, holidays or other scheduled leave; or absences of less than a full day. Table 2. Turnover Rates (separations as a percent of the average workforce) April 2014 May 2014 June 2014 Low 1st Quartile Median 3rd Quartile High Low 1st Quartile Median 3rd Quartile High Low 1st Quartile Median 3rd Quartile High All employers (131) 0.00 0.0 0.9 1.6 10.7 0.00 0.0 0.9 1.7 11.6 0.00 0.0 0.8 1.5 11.8 By Workforce Size Fewer than 250 (72) 0.00 0.0 0.0 1.8 10.7 0.00 0.0 0.0 1.7 11.6 0.00 0.0 0.6 2.1 11.8 250-499 (19) 0.00 0.7 1.1 1.6 5.8 0.30 0.6 1.1 1.8 9.1 0.00 0.6 0.9 1.3 5.1 500-999 (14) 0.34 0.6 1.3 1.7 3.8 0.34 0.6 1.2 1.9 3.8 0.00 0.4 1.2 2.1 4.2 1000-2499 (8) 0.38 0.6 0.9 1.0 1.1 0.36 0.6 1.0 1.4 2.7 0.36 0.6 0.8 1.0 2.1 2500+ (18) 0.00 0.6 0.8 1.1 3.8 0.00 0.5 0.9 1.6 4.7 0.00 0.4 0.9 1.2 7.2 By Industry Manufacturing (31) 0.00 0.4 1.0 1.7 10.4 0.00 0.4 1.0 2.3 9.1 0.00 0.6 1.0 1.7 7.7 Nonmfg (64) 0.00 0.0 0.7 1.5 10.7 0.00 0.0 0.6 1.6 11.6 0.00 0.0 0.6 1.4 11.8 Finance (11) 0.00 0.7 1.1 1.7 10.0 0.00 0.0 1.3 1.7 2.7 0.00 0.0 0.8 2.1 11.1 Nonbusiness (36) 0.00 0.4 0.9 1.8 5.9 0.00 0.4 1.1 1.6 4.7 0.00 0.3 0.9 1.7 7.6 Health Care (13) 0.00 0.7 0.9 1.5 3.8 0.36 1.0 1.2 1.6 3.7 0.54 0.7 1.0 1.2 4.2 By Region Northeast (25) 0.00 0.0 0.7 1.3 3.0 0.00 0.0 0.9 1.4 2.3 0.00 0.0 0.8 1.2 2.3 South (46) 0.00 0.0 0.9 1.6 10.4 0.00 0.3 1.0 1.8 6.3 0.00 0.0 0.9 2.0 9.1 North Central (39) 0.00 0.0 0.7 1.6 10.0 0.00 0.0 0.7 1.6 9.1 0.00 0.0 0.7 1.4 11.8 West (21) 0.00 0.8 1.1 2.0 10.7 0.00 0.0 1.0 2.7 11.6 0.00 0.0 1.0 2.1 7.7 Number of separations during month Rates computed as: × 100 Avg. no. of employees on payroll during month Turnover figures cover permanent separations, whether voluntary or involuntary. They do not include job eliminations, reductions-in-force, long-term leaves of absence, layoffs or departures of temporary staff. Note: Tables 1 and 2 show the range of absence and turnover rates reported for each month. Between the first and third quartiles fall half of the reported rates; a fourth of the employers had rates below the first quartile, and a fourth had rates above the third quartile. The number of responding employers in each category is indicated by the figures in parentheses. The Survey Sample: This survey is conducted quarterly among a panel of human resource executives representing organizations throughout the United States. Of the 154 employers responding in time for tabulation of this quarter’s survey, 54 percent have fewer than 250 workers, 13 percent have workforces of 250 to 499 employees, 12 percent employ 500 to 999 workers, 6 percent have workforces of 1,000 to 2,499 employees and 15 percent employ at least 2,500 workers. By industry, 23 percent of the organizations are manufacturing companies, 51 percent are nonmanufacturing firms and 25 percent are nonbusiness establishments. By region, 18 percent of the employers are located in the Northeast, 38 percent operate in the South, 27 percent are located in North Central states and 18 percent operate in the West. Estimated total employment of the responding organizations: 635,962. S-4 (No. 35) 9-2-14 COPYRIGHT ஽ 2014 BY THE BUREAU OF NATIONAL AFFAIRS, INC. BTM ISSN 0525-2156