
Recommended
Recommended
More Related Content
What's hot
What's hot (7)
Viewers also liked
Viewers also liked (20)
Similar to Report WP1
Similar to Report WP1 (20)
Report WP1
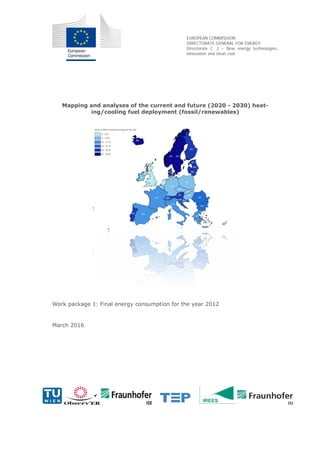
- 1. EUROPEAN COMMISSION DIRECTORATE-GENERAL FOR ENERGY Directorate C. 2 – New energy technologies, innovation and clean coal Mapping and analyses of the current and future (2020 - 2030) heat- ing/cooling fuel deployment (fossil/renewables) Work package 1: Final energy consumption for the year 2012 March 2016
- 2. Authors Fraunhofer Institute for Systems and Innovation Research (ISI) Project coordination: Tobias Fleiter - Email: tobias.fleiter@fraunhofer.isi.de Jan Steinbach - Email: jan.steinbach@fraunhofer.isi.de Mario Ragwitz - Email: mario.ragwitz@fraunhofer.isi.de Marlene Arens, Ali Aydemir, Rainer Elsland, Tobias Fleiter, Clemens Frassine, Andrea Herbst, Simon Hirzel, Mario Ragwitz, Matthias Rehfeldt, Matthias Reuter, Jan Steinbach Breslauer Strasse 48, 76139 Karlsruhe, Germany Fraunhofer Institute for Solar Energy Systems (ISE) Jörg Dengler, Benjamin Köhler, Arnulf Dinkel, Paolo Bonato, Nauman Azam, Doreen Kalz Heidenhofstr. 2, 79110 Freiburg, Germany Institute for Resource Efficiency and Energy Strategies GmbH (IREES) Felix Reitze, Felipe Andres Toro Chacon, Philipp Willmann, Sami Maliha, Michael Schoen Schönfeldstr. 8,76131 Karlsruhe, Germany Observ'ER Frédéric Tuillé, GaëtanFovez, Diane Lescot 146 rue de l'Université, 75007 Paris, France Technical University Vienna - Energy Economics Group (EEG) Michael Hartner, Lukas Kranzl, Andreas Müller, Sebastian Fothuber, Marcus Hummel, Albert Hiesl, Gustav Resch, Eric Aichinger Gusshausstrasse 25-29/370-3, 1040 Vienna, Austria TEP Energy GmbH (TEP) Ulrich Reiter, Giacomo Catenazzi, Martin Jakob, Claudio Naegeli Rotbuchstr.68, 8037 Zurich, Switzerland Quality Review Prof. Wolfgang Eichhammer Fraunhofer Institute for Systems and Innovation Research (ISI) Prof. Hans-Martin Henning Fraunhofer Institute for Solar Energy Systems (ISE)
- 4. Table of contents 1 Objective and approach ............................................................................. 1 1.1 Objective................................................................................. 1 1.2 Method................................................................................... 3 2 Assessment of national and EU energy statistics............................................. 4 2.1 Eurostat energy balance .............................................................. 4 2.2 National energy balances ............................................................. 6 2.3 Additional data sources...............................................................10 2.4 Summary ...............................................................................11 3 Methodology to derive end-use energy balances ........................................... 13 3.1 Applied approaches to derive useful and final energy balances................13 3.2 Adopted energy balance framework................................................16 3.3 Space heating .........................................................................17 3.4 Space Cooling .........................................................................21 3.5 Other energy services ................................................................25 3.6 Definition of energy carriers..........................................................29 4 Sector specific data processing ................................................................. 31 4.1 Industry .................................................................................31 4.2 Tertiary sector .........................................................................54 4.3 Residential sector .....................................................................60 4.4 District heating systems ..............................................................70 4.5 Renewable energy sources (cross-sectoral) ......................................73 5 Results................................................................................................. 82 5.1 Overall ..................................................................................82 5.2 Industry sector .........................................................................93 5.3 Residential sector ...................................................................102 5.4 Tertiary sector .......................................................................110 5.5 District heating and cooling ........................................................116
- 5. 6 Summary, conclusions and recommendations ............................................ 127 6.1 Summary .............................................................................127 6.2 Quality of results.....................................................................130 6.3 Conclusions ..........................................................................132 6.4 Recommendations ..................................................................133 7 Literature ............................................................................................ 134 8 Annex................................................................................................. 139 8.1 Structure of energy balances by Eurostat........................................139 8.2 Structure of products (Eurostat) ...................................................143
- 6. List of figures Figure 1: Structure of end-use balances calculated in comparison to Eurostat final energy balances.............................................................. 2 Figure 2: Hierarchy of balances ............................................................. 6 Figure 3: Relation between final energy and useful energy ........................... 14 Figure 4 : System boundaries and energy flow definitions in the energy balances of buildings ............................................................ 16 Figure 5: Energy balance for space heating in buildings............................... 18 Figure 6: Energy balance of buildings with focus on system part, heating mode............................................................................... 19 Figure 7: System boundaries for measuring the seasonal performance factor. .... 20 Figure 8: Energy balance of building part, cooling mode (blank arrows: usually warm part of energy supply, dotted arrow: cold part). ...................... 22 Figure 9: Energy balance of buildings system part, cooling mode (blank arrows: usually warm part of energy supply; dotted arrow: cold part, cooling is extracted).............................................................. 23 Figure 10: Energy input and heat fluxes in the case of a cooling or freezing device or system (simplified representation). ................................ 28 Figure 11: Overview of the data compilation to derive end-use energy balances for the industrial sector .......................................................... 32 Figure 12: Schematic representation of end-use balance model calculation for the industry sector (FORECAST-Industry) ................................... 33 Figure 13: Different process cooling applications across industry and tertiary sectors............................................................................. 46 Figure 14 Flow chart, describing the dataset used to calibrate the FORECAST Tertiary model .................................................................... 57 Figure 15: Structure of residential sector end-use balance ............................. 60 Figure 16 Data compilation for heating and cooling end-use balance in the residential sector ................................................................. 61 Figure 17: Primary energy demand for EU28 by energy carrier for H/C in all sectors in 2012 [TWh] ........................................................... 82 Figure 18: Final energy demand for EU28 by end-use for H/C in all sectors in 2012 [TWh]........................................................................ 83 Figure 19: Final energy demand for EU28 for H/C by end-use and sector [TWh] ... 84
- 7. Figure 20: Final energy demand for EU28 by energy carrier for heating and cooling [TWh]......................................................................85 Figure 21: Final energy demand for EU28 by end-use and energy carrier in 2012 [TWh] ........................................................................86 Figure 22: Useful, final and primary energy demand for H/C in the EU28 by end-use in 2012 [TWh]...........................................................87 Figure 23: Final energy demand for EU28+3 countries by end-use in 2012 [TWh] ...............................................................................88 Figure 24: Share of H&C energy demand in total final energy demand in 2012......89 Figure 25: Final energy demand for H/C in the EU28+3 countries by energy carrier in 2012 [TWh] .............................................................90 Figure 26: Share of RES in total primary energy demand for H&C in 2012 ...........91 Figure 27: Share of natural gas in total primary energy demand for H&C in 2012 ................................................................................92 Figure 28 Final energy demand for EU28 by temperature level for process heating and cooling in industry in 2012 [TWh]................................93 Figure 29: Final energy demand for EU28 by temperature level and sub-sector for heating and cooling in industry in 2012 [TWh] ............................94 Figure 30: Final energy demand for EU28 by energy carrier for heating and cooling in industry [TWh].........................................................95 Figure 31: Final energy demand for H/C in industry by energy carrier and end- use for the EU28 in 2012 [TWh] ................................................96 Figure 32: Final energy demand for H&C in industry by country and temperature level .................................................................97 Figure 33: Final energy demand for cooling in industry by country and temperature level .................................................................98 Figure 34: Share of process heat demand above >500°h in total industrial H&C final energy demand in 2012. ...................................................99 Figure 35: Final energy demand for H&C in industry by country and energy carrier.............................................................................100 Figure 36: Share of renewable energy sources in heating and cooling primary energy demand in industry in 2012...........................................101 Figure 37: Shares of end-uses on total residential sector final energy demand in EU-28 ..........................................................................102 Figure 38: Final energy demand of residential end-uses by building category and region type in EU-28 ......................................................103
- 8. Figure 39: Final energy demand by end-uses and energy carriers in EU28.........104 Figure 40: Share of energy carriers on final heating and cooling demand (EU- 28, Norway, Switzerland, Iceland) ............................................104 Figure 41: Comparison of specific energy demand for space heating in 2012......105 Figure 42: Share of heating and cooling end-uses per country .......................106 Figure 43: Comparison of results for space cooling energy consumption ...........107 Figure 44: Share of energy carriers on total heating and cooling demand by country............................................................................108 Figure 45: Share of RES in total primary energy demand for heating and cooling in the residential sector in 2012 .....................................109 Figure 46 Share of final energy demand per end uses for all services sub- sectors of EU28 .................................................................110 Figure 47 Fuel shares to cover final energy demand for heating and cooling in the services sector..............................................................111 Figure 48 Final energy demand of the different sub-sectors in the tertiary sector..............................................................................112 Figure 49 Primary energy demand for H/C in the services sector....................112 Figure 50 Final energy demand per fuel type and end use in [TWh] for H/C in the services sector..............................................................113 Figure 51 Share of different end-uses in comparison to the total H/C demand per country. On the secondary axes (right) the sum of H/C demand per country is shown in TWh ..................................................114 Figure 52 Share of energy carriers to cover H/C demand per country. On the secondary axes (right) the total demand per country is shown in TWh ...............................................................................114 Figure 53: Share of RES in total primary energy demand for heating and cooling in the tertiary sector in 2012..........................................115 Figure 54: District heating final consumption in 2012...................................116 Figure 55: Percentage of the population served by district heating in 2013 .........117 Figure 56: Percentage of the population served by district heating in 2013 .........117 Figure 57: District cooling final consumption in 2012 ...................................118 Figure 58: Share of CHP in district heating generation in 2013 .......................121 Figure 59: Final energy demand for EU28 by end-use for H/C in all sectors in 2012 [TWh].......................................................................129
- 9. List of tables Table 1: Organisations contacted during the research process ....................... 7 Table 2: Availability of national data ....................................................... 9 Table 3: Data collected by ODYSSEE....................................................10 Table 4: Methodologies used for the preparation of end-use balances..............12 Table 5 Summary of the approach used in this study for the different energy services.............................................................................15 Table 6: Different definitions of useful energy for process heat.......................26 Table 7: Overview of energy carriers used in this study ...............................29 Table 8: Definition of energy carriers used related to the Eurostat energy balances............................................................................30 Table 9: Overview of processes/products covered in FORECAST-Industry for bottom-up calculation by sub-sector ...........................................34 Table 10: Definition of temperature levels for process cooling and process heating..............................................................................35 Table 11: Overview of sources used for production data for all countries and major processes...................................................................36 Table 12: SEC and share of fuels/electricity used for heating/cooling by process. ............................................................................37 Table 13: Temperature level of H/C demand as share of total H/C demand by process. ............................................................................40 Table 14: Assumptions of floor area in industrial buildings, SEC and share floor area cooled and ventilated by country. ..................................44 Table 15: Temperature shares by sub-sector for gap calculations.....................45 Table 16: Annual production of Oxygen by country for 2008 and 2012 [t/a]..........47 Table 17: Estimation of input data quality for the industrial sector .....................50 Table 18: Overview of robustness of results for the industry sector ...................52 Table 19: Considered economic sub-sectors of the tertiary sector ....................55 Table 20: The energy services considered and their related energy service driver................................................................................56 Table 21: Estimation of input data quality for the services sector......................58 Table 22: Overview of robustness of results for the tertiary sector. The importance of the different fuels is included in the uncertainty evaluation. .........................................................................59
- 10. Table 23: Categorisation of data source used to derive space cooling demand .... 65 Table 24: Share of population by building category and region type in 2012........ 67 Table 25: Overview of the robustness of results for the residential sector........... 68 Table 26: Estimation of input data quality for the district heating and cooling sector .............................................................................. 72 Table 27: Details of the RES sectors and sub-sectors covered ....................... 74 Table 28: RES Final energy consumption breakdown per end uses in industry sector .............................................................................. 75 Table 29: RES Final energy consumption breakdown per end uses in residential sector ................................................................. 76 Table 30: RES Final energy consumption breakdown per end uses in services sector .............................................................................. 76 Table 31: Contacted authority per country................................................ 77 Table 32: Details of the EU28 countries treatment ...................................... 79 Table 33: Details of the data collected for 5 main countries ........................... 80 Table 34: Overview of result quality for RES data collection........................... 81 Table 35: District heating and cooling – final consumption in 2012..................119 Table 36: Energy supply composition for district heating generated in 2012. ......122
- 12. Work package 1: Final energy consumption for the year 2012 1 1 Objective and approach 1.1 Objective Work package (WP) one assesses the status-quo of energy demand for heating and cooling in the European countries in the year 2012. The main goal of the WP is the calculation of a consistent European end-use energy balance for heating and cooling. In contrast to classical energy balances that show sectors and energy carriers, end- use energy balances also include information on the purposes energy is used for. Ex- amples are space heating or water heating. Consequently, end-use balances provide valuable information to understand the structure of energy demand and provide a ba- sis for demand-oriented energy policies. The following objectives are part of WP1. • Quantification, description and graphical depiction of the final energy de- mand related to heating and cooling in the sectors households (residential), industry and services/ tertiary, disaggregated in energy carriers and end- use categories. • Provision of a similar quantification also for useful and primary energy de- mand by country. • Assessment of available national and EU energy statistics and other data collections on heating and cooling, and the current data collection practice in Member States. Identify data gaps and derive recommendations on how to improve data collection. The results of WP1 are considered to be fundamental to other work packages, particu- larly WP3 (scenario analysis) and WP4 (economic analysis). On the other hand, WP 1 strongly relies on WP2 (technology assessment) to establish consistent conversion efficiencies from final energy demand to useful energy demand. Data delivery and disaggregation in particular includes the split of energy carriers, end-uses and sectors as set out above in the description of the general scope of the project by country. The end-use categories space heating, water heating, process heating, space cooling and process cooling are distinguished. For process heating and cooling individual temperature levels are distinguished. For the industrial and the ter- tiary sector energy balances by country are further broken down into sub-sectors, whereas in the residential sector they are broken down by building type and into ur- ban and rural regions. Figure 1 provides a full overview of the dimensions considered.
- 13. Work package 1: Final energy consumption for the year 2012 2 Figure 1: Structure of end-use balances calculated in comparison to Eurostat final energy balances Space heating Water heating Space cooling Process heating Process cooling Cooking Ambient heat Coal Oil Natural gas Other fossil Waste non-RES Used by (sectors)Energy carriers Households Services Industry Urban/ rural SFH / MFH Economic sub- sectors Used for (end-uses) Economic sub- sectors Solar energy Biomass Geothermal Waste RES Added by the projectCovered by EUROSTAT Improved by project Cooling < -30°C Cooling -30 – 0°C Cooling 0-15°C Heating <100°C Heating 100-200°C Heating 200-500°C Heating >500°C Electricity District heating
- 14. Work package 1: Final energy consumption for the year 2012 3 1.2 Method In order to achieve the objectives stated above, we structure our approach into the following methodological steps: • Assessment of national and EU energy statistics and of other data sources: As a first step, we assess national and EU statistical data and other data collec- tions such as energy consumption data bases and energy use balances from individual countries. Moreover, data sources of underlying or indirect character such as building stock and technology stock data as well as sales statistics will be included. Comparing the data requirements arising from the scope of this study we identify main data gaps. Some of these data gaps are even obvious now. • Methodology to derive end-use balances: In the second step we will develop the methodology framework to fill these data gaps. Recommendations will be provided how to fill data gaps in national and EU statistics to improve the data beyond this project • Sector-specific approach to derive end-use energy balance: In this step, we set up a detailed approach for each sector with the goal of closing the existing data gaps and providing a consistent end-use energy bal- ance by country. Therefore, a combined approach consisting of a collection of national data sources and EU-wide sector modelling is applied. • Calculation of final energy for heating and cooling. Based on this additional data generated by the previous steps and by WP2 we derive a final energy balance, following a combined bottom-up and top-down approach. • Calculation of useful and primary energy for heating and cooling: Finally, we calculate useful and primary energy demand by taking into account the technological specification and efficiency values from WP2 based on the fi- nal energy demand balance.
- 15. Work package 1: Final energy consumption for the year 2012 4 2 Assessment of national and EU energy statistics 2.1 Eurostat energy balance Complete energy balances for primary and final energy carriers (table “nrg_110a”) for almost all EU (EEA1 ) member states and acceding or candidate states2 are available in the database of Eurostat over the website or the bulk download facility provided by Eurostat. The comprehensive structure of Eurostat energy balances and the break- down of energy carriers can be found in annex 8.1 and 8.2. Eurostat provides 129 dif- ferent products for up to 650 categories in its balances, which shows the richness of detail of these data collections. However, little information is available on actual en- ergy balances including useful energy as introduced in (Eurostat, 1978). Eurostat compiles a report on the quality of data regarding energy statistics based on Regulation (EC) No 1099/2008 of the European Parliament and of the Council of 22 October 2008 in intervals of five years (European Commission 2014). This report pro- vides information on several quality indicators defined in the ESS Standard for Quality Reports (ESQR) and the Quality report of European Union energy statistics such as: • Completeness defined as the ratio of the number of data cells provided to the number of data cells required, meaning that data missing due to dero- gations/confidentiality or any other reason are included. The ratio is com- puted for a chosen dataset and a given period. • Coherence and comparability where coherence refers to the degree to which the statistical processes by which statistics were generated used the same concepts - classifications, definitions, and target populations – and harmo- nised methods. Comparability is a special case of coherence where the sta- tistical outputs refer to the same data items and the aim of combining them is to make comparisons over time, or across countries, or across other do- mains. • Accessibility, which measures the ease with which users can obtain data de- scribing the associated set of conditions and modalities Eurostat reports that the criterion of completeness is fulfilled for all its annual energy data collections with very few exceptions (e.g. nrg_105a, nrg_106a) or exceptions simply regarding some sub-aggregates (nrg_107a) (European Commission 2014). Due to a high level of collaboration with other international organisations and joint questionnaires between Eurostat, IEA and UN, the energy data provided can be con- sidered as fully comparable and coherent in the most important cases. However, for some special cases statistics may not be completely coherent, in the sense that they may be based on different approaches, classifications and methodological standards. The criterion of accessibility can be considered as being fulfilled at the level of usage 1 Except Liechtenstein and Iceland (available only until 2014 due to reporting is- sues) 2 Albania, the former Yugoslav Republic of Macedonia, Montenegro, Serbia and Tur- key
- 16. Work package 1: Final energy consumption for the year 2012 5 for this study as all data is obtainable free of charge as bulk data from the Eurostat website. However these data, available in both kilotons of oil equivalent (ktoe) and terajoule (TJ), have only one, or no decimal place. This may lead to differences due to rounding when aggregating data, but might be negligible due the relatively small per- centage of deviation.
- 17. Work package 1: Final energy consumption for the year 2012 6 2.2 National energy balances National energy balances (NEB), in a variety of detail, are available for most countries of the European Union. The structure given by the balances compiled by Eurostat pro- vide the “most complete” NEB for comparison. The NEB should at least include primary energy by energy carrier, imports and exports, as well as final energy by energy car- rier for each sector. Figure 2: Hierarchy of balances Source: Fraunhofer ISI In order to obtain all information available on national energy balances, end-use bal- ances and useful energy balances, National Statistical Offices and, if applicable, energy agencies were contacted (Table 1) Energy balance Primary energy Conversion technologies Distribution technologies Final energy End-use balance End-use technologies Useful energy balance Useful energy Motive power Power plant Electricity grid Natural gas Electricity Electric motors
- 18. Work package 1: Final energy consumption for the year 2012 7 Table 1: Organisations contacted during the research process Country Organisation (NSO and/or Agency) Website Austria Statistik Austria Austrian Energy Agency (AEA) www.statistik.at en.energyagency.at Belgium Direction générale Statistique et Information économique Energie Observatorium statbel.fgov.be www.economie.fgov.be Bulgaria National Statistical Institute (NSI) www.nsi.bg Croatia Croatian Bureau of Statistics (DZS) Energy Institute Hrvoje Požar www.dzs.hr www.eihp.hr Cyprus Statistical Service of Cyprus (MOF) www.mof.gov.cy Czech Re- public Czech Statistical Office Ministry of Industry and Trade (MPO) www.czso.cz www.mpo.cz Denmark Danmarks Statistik Danish Energy Agency - Energistyrelsen (ENS) www.dst.dk www.ens.dk Estonia Statistics Estonia (ES) www.stat.ee Finland Statistics Finland www.stat.fi France Service de l'Observatoin et des Statistiques (SOeS) www.statistiques.develo ppement-durable.gouv.fr Germany Statistisches Bundesamt Arbeitsgemeinschaft Energiebilanzen (AGEB) www.destatis.de www.ag- energiebilanzen.de Greece Hellenic Statistical Authority Centre for Renewable Energy Sources and Saving (CRES) www.statistics.gr www.cres.gr Hungary Hungarian Central Statistical Office (KSH) www.ksh.hu Ireland Central Statistics Office Ireland Sustainable Energy Authority of ireland (SEAI) www.cso.ie www.seai.ie Italy Istituto Nazionale di Statistica Ministero dello sviluppo economico www.istat.it/en www.sviluppoeconomico. gov.it Latvia Central Statistical Berau of Latvia (CSB) www.csb.gov.lv/en Lithuania Statistics Lithuania (LS) Lietuvos Energetikos Institutas www.stat.gov.lt www.lei.lt Luxembourg Institut national de la statistique et des études économi- ques du Grand-Duché du Luxembourg (STATEC) www.statistiques.public.l u Malta National Statistics Office (NSO) www.nso.gov.mt Netherlands Statistics Netherlands (CBS) Energy research Centre of the Netherlands (ECN) www.cbs.nl www.ecn.nl Poland Central Statistical Office of Poland (GUS) Polish National Energy Conservation Agency (KAPE) www.stat.gov.pl www.kape.gov.pl Portugal Direçao Geral de Energia e Geologia (DGEG) www.dgeg.pt Romania Institutul National de Statistica (INSSE) www.insse.ro Slovakia Ministry of Economy of the Slovak Republic (MHSR) www.mhsr.sk Slovenia Statistical Office of the Republic of Slovenia www.stat.si Spain Instituto para la Diversificacion y Ahorro de Energía (IDEA) www.idae.es Sweden Statistiska centralbyrån (SCB) www.scb.se United King- dom Office for National Statistics (ONS) Department of Energy & Climate Change (DECC) www.ons.gov.uk www.gov.uk Norway Statistik Sentralbyra (Statistic Norway) www.ssb.no Iceland Statistics Iceland www.statice.is
- 19. Work package 1: Final energy consumption for the year 2012 8 Country Organisation (NSO and/or Agency) Website National Energy Authority (NEA) www.nea.is Switzerland Swiss Federal Office of Energy (SFOE) www.bfe.admin.ch Source: Fraunhofer ISI End-use balances (EUB) show final energy consumption for different applications in the industry, household and tertiary sectors. They includes heating, cooling, process heat (or cooking) and electrical appliances such as motors or domestic appliances. They are less commonly available than NEBs as there are more difficulties gathering the data needed by extensive studies and surveys (Table 2). Following the adoption of the Commission Regulation (EU) No 431/2014, amending Regulation (EC) No 1099/2008 of the European Parliament and of the Council on en- ergy statistics, as regards the implementation of annual statistics on energy consump- tion in households Member States will be required to report detailed statistics on the energy consumption in households by type of end-use. Useful energy balances also include information regarding overall energy efficiency of a sector and its particular end-uses. In contrast to end-use balance, energy conversion efficiencies of the appliances specific to the end-use are considered in these balances and the portion of final energy which is actually available after final conversion to the consumer for the respective use is calculated. In final conversion, electricity becomes, for instance, light, motive energy or heat (see Figure 2).
- 20. Work package 1: Final energy consumption for the year 2012 9 Table 2: Availability of national data Country Energy balance3 End-use balance4 Useful energy balanceIndustry Households Tertiary /Services Transport Belgium X (+R) - - - - - Bulgaria X (+R) - - - - - CzechRep. X - - - - - Denmark X (+R) - S A - M - Germany X (+R) S H A Ph S H A Ph S H A Ph/c M - Estonia X - - - - - Ireland X (+R) - - - - - Greece X - S H A P - - - Spain X (+R) - S H A P - - - France X (+R) A P S H Ph S H Ph - - Croatia X - - - - - Italy X H H - - - Cyprus - - - - - - Latvia X Lithuania X (+R) - - - - - Luxembourg X (+Rw) - - - - - Hungary X - - - - - Malta - - - - - - Netherlands X (+R) - S H A Ph * - - - Austria X (+Rw) S H A Ph S H A Ph S A P M - Poland X (+R) - - - - - Portugal X (+R) - S H Ph - - - Romania X - - - - - Slovenia X (+R) - S H A Ph/c - - - Slovakia X - - - - - Finland X (+Rw) S S H A Ph S - S Sweden X (+Rw) - S H - - - United King- dom X (+R) S A Ph/c S H A Ph S H A Ph/c M - Iceland X - - - - - Norway X (+R) Switzerland X S H A Ph/c S H A Ph/c S H A Ph/c M - Source: Fraunhofer ISI 3 Complete energy balance available (see appendix); +R: Additional balance for renewable energies; Wood consumption accounted explicitly (w) 4 End-use balance by fuel type available for space heating (S), hot water (H), appli- ances (A) and process heating/cooling (Ph/c), transport mode (M)
- 21. Work package 1: Final energy consumption for the year 2012 10 2.3 Additional data sources The project ODYSSEE5 aims to monitor energy efficiency trends in Europe and gathers indicators on energy efficiency, CO2 emissions, detailed data on energy consumption, and activities and related CO2 emissions (around 1000 data series by country) for all 28 Member States including Norway. The project partners, such as energy agencies or statistical organisations, provide detailed data on energy use and activity data which enable ODYSSEE to produce a database of energy efficiency indicators covering the major final energy sectors (see Table 3). The database uses a variety of energy use per activity indicators to highlight differ- ences in energy efficiency between countries and trends. These include, for example: • Energy consumption per dwelling • Energy consumption per unit of Gross Value Added • Energy consumption per employee • Energy consumption per kilometre travelled To aid comparison, the ODYSSEE data include technical adjustments for key determi- nants of energy use in the different sectors (for example, adjustments for climate and structure of industry). Currently, energy efficiency data are available from the year 1990 to 2012. The ODYSSEE indicators are accessible under different data tools: the full database, the key indicators facility, and five specific data facilities that focus on specific issues. The access to the full database is restricted, whereas all other data tools are publicly available. Table 3: Data collected by ODYSSEE Energy balance End-use balance Useful energy balance Industry Households Tertiary/Services Transport ODYSSEE X - S H A Ph/c S H A Ph/c M - Soruce: ODYSSEE MURE 5 http://www.odyssee-mure.eu/
- 22. Work package 1: Final energy consumption for the year 2012 11 2.4 Summary National energy balances differ widely in their quality regarding depth of detail and length of comparable time series. They range from datasets which contain only a few energy carriers, such as electricity, to complete energy balances including additional balances for renewable energies. The lack of data on a national level can however be largely compensated for by energy statistics provided by Eurostat. However, the low availability of national end-use balances remains an issue. Most countries of the Euro- pean Union do not provide these for the industry or tertiary sectors and they are hardly available at all for the transport sector. Nevertheless, from 2016 onwards, re- porting end-use balances of the household sector will be mandatory under Regulation (EU) No 431/2014. The majority of member states already provide substantial infor- mation for this sector. Table 4 shows different methodologies used for the preparation of end-use balances in several countries, such as empirical (surveys, in situ measuring etc.), the preparation through modelling or a mix of both. Useful energy balances on the other hand are almost completely unavailable for all member states of the European Union (Table 2). However, the availability of such data would be necessary to allow a complete picture of the energy chain. By comparing final energy demand data with useful energy demand data, the related losses of the end uses or appliances are made visible. While Eurostat provides highly disaggregated data on energy of an overall high qual- ity, the so called data completeness-rate of the tables “complete energy balances” (nrg_110a) is in the range of 7.4%, considering a total of over three million data points6. This overall rate can be considered as relatively low, but frequent data gaps regarding product for example can be found for “Crude oil”7 and “Natural gas liquids”8. Regarding countries, the main data gaps are for Malta and Cyprus. Thus there is still some potential for improving the coverage and quality of the data collections. 6 share of data not available, e.g. marked by “:”, April 2015 7 product code 3105 8 product code 3106
- 23. Work package 1: Final energy consumption for the year 2012 12 Table 4: Methodologies used for the preparation of end-use balances Country Industry Households Tertiary /Services Denmark - Mix - Germany Mix Empirical Empirical Greece - Empirical - France Empirical Empirical Empirical Austria Empirical Mix Empirical Portugal - Empirical - Slovenia - Model - Finland Mix Empirical Empirical Sweden - Empirical - United Kingdom Model Model Model Switzerland Model Model Model Source: IEA (2014b); Fraunhofer ISI
- 24. Work package 1: Final energy consumption for the year 2012 13 3 Methodology to derive end-use energy balances 3.1 Applied approaches to derive useful and final energy bal- ances From a conceptual point of view, useful energy is defined as the energy required to provide a certain service (e.g. comfortable living areas, use of sanitary hot water, lighting, cooked food, product cooling, etc.). Useful energy appears in different forms, e.g. as heat, cold, air exchange, light, mechanical energy. In other words, as defined by Häfele (1977), “useful energy is the energy available to the consumers after the last conversion made in the consumer energy conversion equipment, hence final en- ergy consumption minus conversion losses” (adopted from Pardo 2012). In Eurostat (1978), a first attempt was undertaken to define useful energy demand balance sheets, using a similar terminology as described in this paper. Useful energy is thus calculated by multiplying final energy by the “efficiency of the final apparatus used by the final consumer” (Eurostat 1978)9 . Although the useful energy balance has a certain importance to evaluate all energy losses within the energy chain, only limited information is available on overall useful energy balances within Europe (see also chapter 2). Due to the fact that no actual data from Eurostat is available regarding useful energy balances, the below described methodology is used to calculate actual useful energy balances on European level. Useful energy can be defined either directly in relation to the provided energy service, or indirectly in relation to final energy. The latter approach is adopted if, in practice, it is not possible or too complex to calculate useful energy based on the provided energy service, or if the necessary calculation parameters are not feasible. The terms final energy and conversion efficiency are introduced to describe the con- cept of useful energy. • Useful energy is provided by converting either fuel-based energy or the en- ergy available and actively collected on-site, which is called final energy 10 . This conversion can be performed by different systems such as boilers, heat pumps, compression cooling systems or furnaces including the respective distribution, storage and delivery equipment (see Figure 3 for a simplified representation). • The factor (ratio) between useful energy and final energy is defined as the conversion and distribution efficiency. For the sake of simplicity, we use the term ‘conversion efficiency’ to cover conversion, distribution, 9 The useful energy balance in (Eurostat, 1978) is calculated based on approximate- ly 30 appliances, for a various set of fuels, distinguishing between 3 sectors (in- dustry, transport and households & equivalents). The useful energy balance is available for France and the former Federal Republic of Germany. Main differences between (Eurostat, 1978) and this paper exist regarding the sector aggregations, fuel types and efficiency levels. 10 Final energy as defined by Eurostat is the energy supplied to the final consumer
- 25. Work package 1: Final energy consumption for the year 2012 14 storage and delivery losses. Losses outside the conversion device or system – e.g. through the building envelope, or air exchange – and internal heat gains are usually not considered part of conversion efficiency, but as part of ‘useful energy need’. Figure 3: Relation between final energy and useful energy Source: Fraunhofer ISI, TEP Energy There are two different definitions of useful energy depending on the approach used: 1. Definition based on final energy demand and conversion efficiency (FED approach): in this case, useful energy is defined as the final energy multiplied by the conversion efficiency of the devices generating the useful energy (e.g. final energy consumption of a heating system multiplied by the conversion efficiency of the heating system). 2. Definition based on energy service (ESV approach): in this case, useful energy is defined at the level of services, such as the required indoor tem- perature, and boundary conditions, for instance, thermal heat losses and gains in the case of space heating. In practice, the following challenges and limitations have to be taken into account when surveying and/or estimating useful energy demand: 1. FED approach: In the past, only commercially traded energy carriers were included in final energy demand statistics, which leads to an underestima- tion of useful energy demand. Energy collected on-site, such as solar ther- mal energy, is currently partly included in the official statistics. This gap will be closed by considering all the relevant final energy consumption in our estimation approaches, particularly within our models. 2. ESV approach: This approach requires the definition of a service level such as indoor temperature, ventilation rate, relative humidity etc. The generic service levels defined in norms and standards may not be met in practice. This leads to deviations between the expected useful energy (need) and the actual useful energy demand. For instance, in the case of fuel poverty, in- adequate control or different comfort requirements may lead to different
- 26. Work package 1: Final energy consumption for the year 2012 15 service levels with regard to the average indoor temperature. In these cases, calculations of useful energy may lead to different results in the two approaches mentioned above, particularly if only energy consumption is measured and the actual service level is not taken into account. In practice, the simple concepts introduced in this section need to be differentiated and substantiated by the different constellations of energy services (space heating, process heating, space cooling, etc.) and technologies. Thus, different system bounda- ries and approaches are defined to substantiate the generic concepts, and described in following sections. Table 5 shows the approach taken in this study to estimate useful energy for different energy services depending on the definition and the data avail- able. Table 5 Summary of the approach used in this study for the different energy services FED Approach ESV Approach Space heating All sectors Space cooling Household sector Tertiary and industry sectors Water heating All sectors Process cooling All sectors Oven (cooking) All sectors Process heating Most processes (cross-cutting) Selected processes (e.g. clinker burning, blast furnace) Source: Fraunhofer ISI; TEP Energy
- 27. Work package 1: Final energy consumption for the year 2012 16 3.2 Adopted energy balance framework For the case of buildings, the definitions of useful and final energy as well as the con- version efficiencies of heating and cooling energy services are based on established EU norms and standards (DIN EN 15603:2013; ISO 13790:2008). Useful energy refers to “energy need” as depicted in Figure 4 – not to be confused with “energy use” or “sup- plied energy”. In the case of space heating and hot water, this is the final energy in- cluding actively collected solar energy and ambient heat but excluding conversion and distribution losses. Passive solar energy collected through windows and the energy recovered and re-used, e.g. from heat recovery systems or internal heat loads, are not included. In the following, the different energy services are described in more detail. Figure 4 : System boundaries and energy flow definitions in the energy bal- ances of buildings Source: Adopted from Müller (2015)
- 28. Work package 1: Final energy consumption for the year 2012 17 3.3 Space heating 3.3.1 Useful energy demand for space heating Referring to the second energy service approach introduced in section 3.1, the defini- tion of useful energy in the case of space heating is based on the standard ”Energy performance of buildings — Calculation of energy use for space heating and cooling” (ISO 13790:2008): “3.4.1 Energy needs for heating or cooling to be delivered to, or extracted from, a conditioned space to maintain the intended temperature conditions during a given period of time NOTE 1 The energy need is calculated and cannot easily be measured. NOTE 2 The calculated energy need can include additional heat transfer resulting from non-uniform temperature distribution and non-ideal temperature control by increasing (decreasing) the effective temperature for heating (cooling).” The standard describes various calculation methods (seasonal or monthly/ simple hourly / detailed simulation) and exact definitions. These detailed definitions are not adopted in this report, but the basic concepts are summarised as follows. Useful en- ergy, i.e. the energy needed for heating, is basically the balance of losses and gains (see Figure 5): Energy needed for heating (QH,nd) includes: • Net ventilation heat losses (Qve). Note: Heat from ventilation losses which is re-covered in the ventilation system (heat recovery unit) (QV,sys,ls,rvd) is not included in this definition of useful energy • Transmission heat losses(Qtr) • Extra losses, because “actual time-averaged (mean) internal temperature can be higher, due to instantaneous overheating” (ΔQtr+ve) These losses are offset (either yearly, monthly or hourly) by solar and internal heat gains, which means that QH,nd (energy needed for heating) does not include: • Heat gains from solar heat (Qsol) • Heat gains from internal heat (Qint) For completeness, three additional types of heat transfer can be accounted for in buildings, but are irrelevant for the energy needed for heating (QH,nd): • Heat recovered in the ventilation system from ventilation losses (heat re- covery unit) (QV,sys,ls,rvd). • Heat recovered in the building from heating system losses (e.g. from hot pipes) (QH,sys,ls,rbl). • Heat recovered in the system from building losses (e.g. heat recovered from building construction to ventilation system) (QH,sys,ls,rvd). The calculation of space heating is restricted to sensible heat (without taking into account the latent heat in humidification (e.g. in ventilation systems)).
- 29. Work package 1: Final energy consumption for the year 2012 18 Figure 5: Energy balance for space heating in buildings. Source: adapted from ISO 13790:2008(E) 3.3.2 Final energy demand for space heating Regarding the definition of final energy demand and referring to Figure 6, we consider EH,gas/oil/del, EH,el,del and EH,ren,in: • EH,gas/oil/del: the “non-renewable” external energy that enters the heating system (in this case neither solar nor environmental heat. Note: biomass is included in external energy). Recovered energy is not considered in the fi- nal energy bal-ance. • EH,el,del: electricity that enters the heating system (e.g. for heat pumps). • EH,ren,in: the renewable energy (solar thermal and environmental heat) used by the heating system (net from losses) Renewable energy (solar thermal and environmental heat) is included as final energy in ISO 13790:2008(E) and in some national energy statistics (e.g. in Switzerland). It should be emphasised that environmental heat (e.g. the ambient heat extracted by air-to-air or air-to-water heat pumps) is not (yet) surveyed in Eurostat. Only the solar energy used in a solar thermal heating system is considered when cal- culating final energy. The solar radiation that heats walls or enters a building through the windows is only considered in the building system (level of useful energy) as re- ducing the energy needed for heating. Final energy is calculated using standard calorimetric data (lower heating value). Standard data only take direct heat into account, not the latent heat in gases, so con- densing heating systems are able to extract more heat than is given in the definition of a conventional calorimeter.
- 30. Work package 1: Final energy consumption for the year 2012 19 The heating system is considered within the building boundaries, so that losses out- side the building are not considered (e.g. heat losses in the distribution systems of district heating and local heating networks). Figure 6: Energy balance of buildings with focus on system part, heating mode Source: Adapted from ISO 13790:2008(E) Heat pumps and ambient heat Environmental heat is officially calculated in heat balances as the difference (see C (2013) 1082: “guidelines for Member States on calculating renewable energy from heat pumps”) between the heat which leaves the heat pump and the electricity which enters the system (taking into account the heat produced by motors). See Figure 5 for a description, where: • ES_fan/pump: Energy used for fan and/or pump that circulates the refrigerant; • EHW_hp: energy used to run the heat pump itself, • Ebp_pump: the energy used to run the pumps that circulate the medium ab- sorbing the ambient energy (when relevant) • EB_fan/pump: the energy used for fan and/or pump that circulates the medium supplying the usable heat; • QH_hp is the heat supplied by the heat source via the heat pump, • QW_hp is the heat generated from mechanical energy used to drive the heat pump;
- 31. Work package 1: Final energy consumption for the year 2012 20 • ERES is the renewable aerothermal, geothermal or hydrothermal energy (the heat source) captured by the heat pump (here defined as environmental heat). E RES = Q H_hp + Q W_hp – E S_fan/pump – E HW_hp • EHW_bu and WHW_bu are the energy and heat of the supplementary heater. For heat pumps, the system boundaries are defined as SPFH2 (in red) in Figure 7. The electricity demand of fans or pumps (and the heat they produce) is included here, but not the supplementary heater and pumps to distribute heat in the building. Figure 7: System boundaries for measuring the seasonal performance factor. Source: adapted from Official Journal of the European Union, 6.3.2013, L 62/31 3.3.3 Conversion efficiency space heating Referring to the first of the two definitions of useful energy provided in section 3.1, efficiency is defined as the ratio between useful energy and final heating energy. Cal- culations are done separately for each heating system. In the case of heat pumps, the coefficient of performance is defined as the ratio of electricity (or other high energy) input (including electricity for internal pumps, mo- tors) to delivered heat (see CODE2 (2013) 1082: “guidelines for Member States on calculating renewable energy from heat pumps”). The additional energy is assumed to be environmental heat (geothermal, water, ambient heat from air etc.). Note that final energy is usually calculated using standard calorimeter values (lower heating value). This implies that the calculated efficiency increases with technical im- provements (particularly with condensation technology), and varies due to different composition of fuels.
- 32. Work package 1: Final energy consumption for the year 2012 21 3.4 Space Cooling 3.4.1 Useful energy for space cooling For space cooling, similar methods are used as for space heating. Similar to the heat- ing case, only sensible cooling is taken into account when calculating “space cooling” demand. The energy need and energy consumption for dehumidification are consid- ered in a separate section. Again, in the case of space cooling, useful energy is defined according to two different approaches (as outlined in section 3.1): the first refers to final energy and the second “per se”, i.e. in terms of energy balances based on well-defined boundary conditions. In the second case, useful cooling energy is defined in a similar way to useful heating energy: The thermal cooling energy needed to maintain rooms in a defined comfort zone is taken into account. Solar heat gains, internally generated heat, and the heat from air exchange offset by losses due to transmission, radiation, ventilation and air exchange (e.g. free cooling during nights) are balanced by providing useful cooling energy (QC, nd, see Figure 8). Similar to the heating case, internal “cooling gains” may also occur: cold that is “lost” from cold appliances, typically in supermarkets with open fridges and freezers. Hence, QC,sys,ls,rvbl describes the “cold recovered in the building, coming from the cooling system losses (e.g. from cold pipes)”, and is not considered part of the cooling demand needed (QC,nd).
- 33. Work package 1: Final energy consumption for the year 2012 22 Figure 8: Energy balance of building part, cooling mode (blank arrows: usu- ally warm part of energy supply, dotted arrow: cold part). Source: adapted from ISO 13790:2008(E) In a moderate climate zone such as the one covering most of Europe, useful energy depends heavily on the defined service levels, which, in turn, depend on conventional comfort concepts and building types. For instance, in the “adaptive comfort” concept, the required or allowed indoor temperature depends on the outdoor temperature be- cause building users adjust their comfort perceptions and expectations to external conditions. Comfort zones are defined in EN 15251:2007: “Indoor environmental input parameters for design and assessment of energy performance of buildings, addressing indoor air quality, thermal environment, lighting and acoustics”. Note that comfort temperatures depend on humidity as well (and vice-versa). In practice, estimating the useful energy needed for space cooling is particularly diffi- cult regardless of which definition in section 3.1 is applied. In the first case, the effi- ciencies of appliances and cooling systems is often unknown (and more important their penetration of the building stock) and, in the second case, it might be unclear which part of the useful energy needed is actually provided (serviced), as service lev- els need to be known alongside the penetration of cooling systems. 3.4.2 Final energy demand for space cooling With regard to the definition of the final energy demand for space cooling (see Figure 9), the applied method is similar to the one used for space heating: Free cooling (e.g. through windows and ventilation openings) is not considered part of the final energy demand, neither is cooling energy from other appliances (cooling “gains” considered as cooling losses from other appliances). Thus, increasing free cooling would not reduce
- 34. Work package 1: Final energy consumption for the year 2012 23 final energy consumption directly, but indirectly by reducing the amount of useful en- ergy needed. Environmental thermal or final energy from renewable sources (e.g. from solar ther- mal) that is used to generate cold or environmental cold (in terms of useful or final energy) and is extracted from the environment (e.g. through heat exchangers from air, ground or water) is considered part of the final energy consumption for space cooling. Figure 9: Energy balance of buildings system part, cooling mode (blank ar- rows: usually warm part of energy supply; dotted arrow: cold part, cooling is extracted). Source: adapted from ISO 13790:2008(E) 3.4.3 Conversion efficiency space cooling Space cooling efficiency can also be derived from the ratio between useful and final energy, but efficiency is usually calculated within the system boundaries of the cooling device and expressed as an Energy Efficiency Ratio (EER). The EERs are then applied to specific buildings. It is very important to calculate energy demand at least once a month, because effi- ciency is heavily affected by conditions such as relative load and temperatures. EER is usually measured in 4 stages, simulating different outdoor temperatures (20, 25, 20 and 35 °C), and taking different boundary conditions into account according to
- 35. Work package 1: Final energy consumption for the year 2012 24 the technologies used (e.g. water temperature) (prEN14825). To be able to compare devices and specify efficiency labels, a reference seasonal EER is calculated (reference SEER). This is done by considering 35°C as the full load capac- ity of the unit and assuming an average European climate, given by the operating hours at different temperatures and interpolation of the above 4 reference tempera- ture stages. For a specific building, the local climate is then used to determine the real SEER. An additional correction is done (e.g. distinguishing SEERon from SEER) to consider stand-by and off-modes. This is consistent with the final energy definition: all (non- renewable) energies which enter the appliance should be taken into account.
- 36. Work package 1: Final energy consumption for the year 2012 25 3.5 Other energy services 3.5.1 Hot Water In the case of hot water, useful energy is defined as the energy needed to heat water to the desired temperature level. For specific cases (e.g. residential buildings, hotels etc.), standard daily uses are defined (showing different usages of showers, hot water and dish-washing etc.) which describe the start time (storage losses), duration and required temperature. Note that, in the case of hot water, useful energy demand may refer to the thermal energy “leaving” the heat generation or hot water storage system rather than the en- ergy “arriving” at the user’s tap (i.e. the boundary is close to the technical generation and storage system and further away from the user). In this study, the “tap” limit is used. This implies that useful energy for hot water depends not only on the type of user (residents, hotel guests etc.) but also on the type of building and the type of technical (distribution and storage) system; distribution and standing losses are not considered part of the useful energy. For the definitions of final energy and efficiency, we refer to the space heating section. The heating units are the same (or similar) to the units used for space heating. Special care should be taken when considering combined space heating and hot water sys- tems: the efficiency of hot water generation is usually lower during the summer sea- son in these systems because the heating system load is (usually) much lower at this time and the system does not operate in an optimal range which implies low effi- ciency. Details are specified in EN 15316-3-1:2007, Heating systems in buildings — Method for calculation of system energy requirements and system efficiencies — Part 3-1: Domestic hot water systems, characterisation of needs (tapping requirements). 3.5.2 Cooking Oven energy efficiency = H1 / (H1 + H2 + H3), where: H1 = heat supplied to food H2 = heat supplied to interior of oven (internal air, racks, internal panels). H3 = heat lost to exterior of furnace or oven. Note: H2 becomes less important with increasing utilisation time (such as in commer- cial kitchens, where ovens can be on for over eight hours at a time). “Measurement of oven efficiency is relatively difficult as this will depend on how the oven is used whereas it is straightforward to measure the energy consumption for a comparison of all ovens on the EU market for EU oven energy labelling scheme.” Note: For conventional domestic ovens, the “wet brick test” is used to calculate the reference energy efficiency: a wet ceramic brick is used to simulate roasting a chicken removed from a refrigerator (i.e. this defines a reference H1). There do not seem to be any reference tests defined for commercial ovens. 3.5.3 Process heat Two key characteristics distinguish the field of process heat from other demand sec- tors. First, this is a broad and very heterogeneous field covering many different heat uses and conversion technologies. Second, energy conversion mostly takes place in
- 37. Work package 1: Final energy consumption for the year 2012 26 conversion chains rather than in individual conversion technologies. Both characteris- tics need to be considered to achieve a practical definition of useful energy for process heat. In the following, several definitions of useful energy are listed and their suitability dis- cussed for the main uses of process heat, steam generation and clinker and blast fur- naces, before the selected method is presented in detail. There are multiple ways to adapt the two main definitions of useful energy to the as- sessment of process heat. All have certain advantages and disadvantages. 1. Based on final energy: a. Average conversion efficiency by energy carrier – technologies are not explicitly considered (as used in Pardo et al. 2013) b. Average efficiency of technologies c. Relation of specific (final) energy consumption (SEC) of average tech- nology to SEC of best (not) available technology (BAT/BNAT) 2. Based on the energy service a. Based on the theoretical minimum for maintaining a chemical reaction and/or the thermodynamic minimum for the required change in the good heated/cooled. b. Based on an energy balance of the conversion unit, including heat losses and heat recuperation. 3. Some useful energy analyses are based on energy analyses (e.g. Cullen and Allwood 2010) taking into account the different qualities of individual energy carriers. Table 6: Different definitions of useful energy for process heat Method Steam generation Clinker burning Blast furnace 1a Easily operational; relation to technology is lost and thus might be less accurate Not operational, because efficiency is not measured, instead specific energy consump- tion (SEC) is used e.g. GJ/t clinker/steel 1b Easily operational; useful heat to be defined in conversion chain (e.g. after steam generation, or after distribution network) 1c Operational, but useful energy then depends on technical progress and neglects that large amounts of energy are still lost despite BAT. 2a Only operational for steam boiler not for entire steam system, be- cause the final product is un- known Operational; assessment is required to be process/product specific. Disadvantage: “theoretical minimum” suggests lowest pos- sible energy demand, but e.g. product shift could further reduce demand. 2b Operational, should be similar to 1b, as the output unit is tons of steam Operational; assessment is required to be process/product specific, results should be similar to 1b Due to the above mentioned arguments, methods 1a, 1c and 2a are not suitable to calculate the useful energy demand for industrial processes. Methods 1b and 2b will be used. Both methods should result in a similar level of useful energy. The following cal-
- 38. Work package 1: Final energy consumption for the year 2012 27 culation method will be used. Following approach 2b, the total energy demand of a furnace can be calculated as (ERA Technology Limited, Bio Intelligence Service 2012): Hf = Hc + Hs + Hg, where: Hf = heat supplied by the fuel input to the furnace Hc = heat supplied to material being processed in furnace Hs = Heat lost by heating the furnace itself (insulation, structure, etc.). This be- comes less important with longer utilization times Hg = heat lost in flue gases. Therefore, the energy efficiency equals ηf = Hc / (Hc + Hs + Hg) This approach includes the burner and potential heat recovery within the system boundaries of the furnace. Accordingly, approach 2b for steam generation is defined as follows (PWC et al. 2014): Hb = Hc + Hs + Hg + Hd, where: Hb = heat supplied by the fuel input to the boiler Hc = heat received after passing the distribution network (water or steam) Hs = Heat lost by heating the boiler itself (insulation, structure, etc.). This becomes less important with longer utilization times Hg = heat lost in flue gases Hd = heat lost in distribution network Therefore, the energy efficiency equals ηb = Hc / (Hc + Hs + Hg+ Hd) This approach includes the burner and potential heat recovery within the system boundaries of the boiler. The approach 1b defines useful energy (or conversion efficiency) for steam genera- tion and furnaces as follows. Ub = Hb * ηb The efficiency ηb can be estimated or calculated based on approach 2b. It should in- clude losses in the distribution network. Process cooling Process cooling is usually defined similar to useful energy in the case of buildings: (thermal) energy needed to compensate (unwanted) heat gains, because of transmis- sion and air leakages. In an ideal case, the only energy needed is the energy to bring the product from its initial temperature down to the desired refrigerator/freezer tem- perature. In practice, however, this is the energy needed to cool down (or freeze) the product and to keep it cool (or frozen). Note that walk-in cold rooms are considered building components (and not as appli- ance/machinery), so they were included in space cooling (with specific temperature requirements for the cold room’s thermal zone). The efficiency of the refrigeration system is expressed by the coefficient of perform- ance (COP), which is the ratio of the refrigeration effect (heat extracted) to the energy
- 39. Work package 1: Final energy consumption for the year 2012 28 input required (see Figure 10): COP = Q1 / E It should be noted that, under this definition, the energy-efficiency potentials on the side of useful energy are not visible. This means that factors influencing the useful energy balance are not considered in this equation (e.g. freezers with/without doors in the retail sector, heat losses outside the motors, etc.). Figure 10: Energy input and heat fluxes in the case of a cooling or freezing device or system (simplified representation). Note:cooling losses in the unit and in the cooling pipe (e.g. in case of remote refriger- ated display cabinets) are included in Q1.
- 40. Work package 1: Final energy consumption for the year 2012 29 3.6 Definition of energy carriers In this study, we distinguish 13 individual energy carriers as shown in Table 7. These comprise the main fossil as well as the main renewable energy sources. Some particu- larities have to be considered. For instance biomass includes all forms of biomass not only solid biomass. In certain cases it is necessary to deviate from this definition, e.g. for the illustration of primary energy where wind, hydro and nuclear play an important role or for the detailed illustration of individual technologies in WP2, where more detail is of interest (e.g. heat pumps distinguishing air and ground source) or where data availability does not allow the breakdown from Table 7. Table 7: Overview of energy carriers used in this study ID Name_EC Comment 1 Electricity 2 Fuel oil 3 Coal 4 Natural gas 5 Other fossil 6 Waste non-RES 7 Biomass including all forms of biomass (liquid, solid and gaseous) 8 District heating 9 Solar energy including solar thermal and PV-heat 10 Ambient heat including ground and air sources 11 Geothermal only "deep" geothermal; no HP 12 Waste RES 13 Other RES A detailed definition of the individual energy carriers used with respect to the Eurostat energy balances is provided in Table 8. Each energy carrier used is calculated as an aggregate of one or more energy carriers from Eurostat. The Eurostat energy carriers listed are a selection that on the one side allows a complete aggregation (equals the sum of all products) and on the other side a detailed allocation to the energy carriers used in this study. In annex 8.2 a complete overview of the energy carriers as pro- vided by Eurostat on the various levels of aggregation is provided.
- 41. Work package 1: Final energy consumption for the year 2012 30 Table 8: Definition of energy carriers used related to the Eurostat energy balances Product code Eurostat Name Eurostat Aggregation used 0000 All products Total 2112 Patent Fuels Coal 2115 Anthracite Coal 2116 Coking Coal Coal 2117 Other Bituminous Coal Coal 2118 Sub-bituminous Coal Coal 2121 Coke Oven Coke Coal 2122 Gas Coke Coal 2130 Coal Tar Fuel oil 2410 Oil shale and oil sands Fuel oil 2200 Lignite and Derivatives Coal 3105 Crude oil (without NGL) Fuel oil 3106 Natural gas liquids (NGL) Other fossil 3220 LPG Other fossil 3214 Refinery gas Other fossil 3215 Ethane Other fossil 3234 Gasoline (without bio components) Fuel oil 3235 Aviation gasoline Fuel oil 3236 Car Spirit Fuel oil 3237 Premium leaded gasoline Fuel oil 3238 Premium unleaded gasoline, 95 Ron Fuel oil 3244 Other kerosene Fuel oil 3246 Gasoline type jet fuel Fuel oil 3247 Kerosene type jet fuel (without bio components) Fuel oil 3250 Naphtha Fuel oil 3260 Gas/diesel oil (without bio components) Fuel oil 3270A Total fuel oil Fuel oil 3281 White Spirit and SBP Other fossil 3282 Lubricants Other fossil 3283 Bitumen Other fossil 3285 Petroleum coke Other fossil 3286 Paraffin Waxes Other fossil 3295 Other Oil Products Other fossil 4100 Natural Gas Natural gas 4210 Coke Oven Gas Other fossil 4220 Blast Furnace Gas Other fossil 4230 Gas Works Gas Other fossil 4240 Other recovered gases Other fossil 5200 Derived Heat District heating 5532 Solar thermal Solar energy 5541 Solid biofuels (excluding charcoal) Biomass 5542 Biogas Biomass 55431 Municipal waste (renewable) Waste RES 5544 Charcoal Biomass 5546 Biogasoline Biomass 5547 Biodiesels Biomass 5548 Other liquid biofuels Biomass 5549 Bio jet kerosene Biomass 5550 Geothermal Energy Geothermal 6000 Electrical energy Electricity 7200 Waste (non-renewable) Waste non-RES
- 42. Work package 1: Final energy consumption for the year 2012 31 4 Sector specific data processing 4.1 Industry 4.1.1 Approach The industrial energy use balance, as it is defined in this study, has five dimensions: • Country • Subsector • Energy carrier • End-use • Temperature level While the first three dimensions are covered by energy balances provided by Eurostat (except for Iceland and Switzerland), the latter either have to be derived from national (end-use) balances (that are not necessarily in line with Eurostat) or by using the bot- tom-up energy demand model FORECAST-Industry. This chapter presents the meth- odology used; it describes how we have constructed end-use energy balances based on the final energy balances provided by Eurostat. For the industrial sector there is only a little information on end-uses from national energy balances, as discussed in section 2. Thus, the use of the FORECAST-Industry model is the central piece in our methodology. We use it to disaggregate the industrial energy demand as stated by Eurostat to provide additional information on end-use and temperature level, supported by information from national statistics. The main data sources and the general data flow are shown in Figure 11. All data used is processed via the FORECAST-Industry model in order to assure a consistent quan- tity structure incorporating all input variables. Feeding all data into the model to gen- erate the full picture on H/C in industry can be regarded as an additional quality check, given that all the individual values are required to match each other. The input data comprises assessments of national data sources on district heating (DC) and RES use, but also industry-specific databases containing activity data (e.g. industrial production and floor area), and technical information for main industrial processes and space H/C. Theoretically, national end-use balances are also consid- ered, however section 2.2 indicates there is little information available. The main input for the model is the Eurostat final energy balance. This is the anchor of the calcula- tions, against which all results are calibrated.
- 43. Work package 1: Final energy consumption for the year 2012 32 Figure 11: Overview of the data compilation to derive end-use energy balances for the industrial sector Source: Fraunhofer ISI In the following, we present more detail of how FORECAST-Industry derives end-use balances from the data listed above. To do this, we use three major categories of data: 1. Activity data (industrial production by process and floor area) 2. Assumptions about specific energy demand of processes and technologies (SEC) 3. Further knowledge about individual processes (applied energy carriers, temperature level etc.) The process flow of the model is shown in Figure 12. The model consists of two main bottom-up calculation schemes: 1. The energy demand of individual energy-intensive processes (e.g. clinker production) 2. The energy demand for space heating and cooling Both of these are based on a demand driver (production and employment) and use a set of technical input variables. The bottom-up calculation, by definition, does not cover the complete energy demand, because a number of smaller processes are not significant enough to be separately modelled. Consequently, the results of the bottom- up calculations are compared with the statistical demand and the gap filled with addi- tional assumptions to arrive at the calibrated final energy demand, broken down by end-use. The three elements of the calculation process are described below. FORECAST– Industry Splitby end-use (space heating,process heat,process cooling) and temperaturelevel Energydemandbyenergy carrier, country, sub- sector and end-use Nationalsources: data on RES Nationalend-use balances (where available) Eurostat FED-industrysector Nationalsources: District heating (DH) Databasesof industrialprocesses and heating technologies
- 44. Work package 1: Final energy consumption for the year 2012 33 Figure 12: Schematic representation of end-use balance model calculation for the industry sector (FORECAST-Industry) Source: Fraunhofer ISI Bottom-up calculation 1: Energy demand for H/C in individual processes The goal of this bottom-up calculation is to calculate energy demand for process heat- ing and cooling in energy-intensive industries differentiated by temperature. The cal- culation is conducted for individual energy-intensive processes. The selection and definition of a “process” depends on various factors including the amount of energy consumed (relevance), the data availability, and the level of homo- geneity (whether the process can be described by average values). Consequently, the definition and system boundaries of individual processes do slightly differ. While a process sometimes describes an individual “process step” (e.g. burning of clinker), it also often describes an entire production line to the final product (e.g. paper). Processes (H/C) Production [t/a] - by process Employment [Pers./a] - by sub-sector and building type FEDc,p, Floor areaC,S,B SEC m²/Person Space heating FEDc,p,H/CShare H/C FEDc,p,H/C,TShare Temp FEDc,p,H/C,T Share EC (Eurostat) FED: Final energy demand SEC: Specific energy demand C: Country P: Process H/C: Heating/Cooling T: Temperature S: Sub-Sector B: Building type E: End-use A: Air conditioning / cooling FEDC,S,B,H SEC [kWh/m²] Share Temp (gap) FEDC,S,B,A SEC [kWh/m²] Share cooled FEDC,S,B,H Bottom-up FEDC,EC,E,T,S FED (Gap)C,S,EC FED C,S,EC,T,E FED (Gap) C,S,EC,T,H FED (Eurostat)C,S,EC Bottom-up / top-down matching Space cooling
- 45. Work package 1: Final energy consumption for the year 2012 34 Table 9: Overview of processes/products covered in FORECAST-Industry for bottom-up calculation by sub-sector Non-metallic minerals Chemicals Non-ferrous metals Container glass Adipic acid Aluminium, primary Flat glass Ammonia Aluminium, secondary Fibre glass Calcium carbide Aluminium extruding Other glass Carbon black Aluminium foundries Houseware, sanitary ware Chlorine, diaphragma Aluminium rolling Technical, other ceramics Chlorine, membrane Copper, primary Tiles, plates, refractories Chlorine, mercury Copper, secondary Clinker Calcination-Dry Ethylene Copper further treatment Clinker Calcination- Semidry Methanol Zinc, primary Clinker Calcination-Wet Nitric acid Zinc, secondary Preparation of limestone Oxygen Gypsum Polycarbonates Cement grinding Polyethylene Lime milling Polypropylene Bricks Polysulfones Lime burning Soda ash TDI Titanium dioxide Iron and steel Food drink and to- bacco Pulp and paper Others Sinter Sugar Paper Plastics: Extrusion Blast furnace Dairy Chemical pulp Plastics: Injection mould- ing Electric arc furnace Brewing Mechanical pulp Plastics: Blow moulding Rolled steel Meat processing Recovered fi- bres Coke oven Bread & bakery Smelting reduction Starch Direct reduction Source: Fraunhofer ISI The following methodology is used for each of the processes considered. The energy demand of a process (ED) is calculated as the specific energy consumption (SEC) of one process multiplied by the total annual production (IP) of the same proc- ess. Distinction by heating/cooling and temperature level is made through the multi- plication by the share of heating/cooling in the SEC (ShareH/C) as well as the share of each temperature level in the SEC (ShareTEMP): , , , , , , , , , , ,* * * / *p t c ec t p c t p c t p ec c p p ecED IP SEC ShareEC ShareH C ShareTEMP= (1) Where t = year, p = process, ec = energy carrier, c = country Consequently, for each process, the following data is required:
- 46. Work package 1: Final energy consumption for the year 2012 35 • Annual production [t/a] • Specific energy fuel/electricity consumption (SECf/e) [GJ/t] • Share of energy carriers (derived from Eurostat energy balance by sub- sector) • Share of heating/cooling in SEC • Share of temperature level in heating/cooling (see Table 10 for the defini- tion of temperature levels) These shares, as well as the SEC by process, do not vary between the individual coun- tries. However, the industrial structure does vary, and this is fed into the model via the production in tonnes. Thus, we gain individual end-use and temperature differenti- ated energy balances for the processes in scope. Table 10: Definition of temperature levels for process cooling and process heat- ing End-use Temperature level Comment Process cooling < - 30°C Mostly air separation in chemical industry - 30-0 °C Mostly refrigeration in food industry 0-15 °C Mostly cooling in food industry Process heating <100°C Low temperature heat (hot water) used in food industry and others 100-200 °C Steam, of which much is in paper, food and chemi- cal industry 200-500 °C Steam used mostly in chemical industry >500 °C Industrial furnaces in steel, cement, glass and other industries Bottom-up calculation 2: space heating and cooling The main driver of the space heating and cooling demand is the floor area of industrial buildings, including production and office buildings. Energy demand is included as spe- cific energy consumption (SEC) per m² floor area. We also use the SEC per m² cooled area for the cooling demand. The cooled area is calculated by assuming a country-specific share of the total floor area. Matching bottom-up calculation to total final energy demand The total of the bottom-up calculation of process H/C demand and space H/C demand on a sub-sector level does not exactly match with the Eurostat energy balances. For most sub-sectors and countries a gap is expected. This gap varies substantially be- tween sub-sectors and countries depending on the coverage of the processes consid- ered in the bottom-up calculation and the industrial structure of the country. Sectors such as iron and steel, pulp and paper or non-metallic minerals are typically well cov- ered (small gap). Other sectors, such as the chemical industry, the food and tobacco industry or the other industries are less completely covered due to a high number of minor processes (larger gap). In order to close the gap between the bottom-up calculation and energy balances, a top-down estimate is used. We assume that fuels (final energy minus electricity) are completely used for heating in industry (cooling and mechanical energy make up only
- 47. Work package 1: Final energy consumption for the year 2012 36 marginal proportions < 1%). Accordingly, the gap in fuels can fully be allocated to process heat. Then it is only the allocation to temperature levels which has to be added to the process heat demand from the gap. This is done by exogenously assum- ing temperature shares for each sub-sector (see Table 15). 4.1.2 Data used In the following the data used is described for each of the calculation steps described above. Bottom-up calculation 1: Energy demand for H/C in individual processes Annual industrial production by process and country in terms of, for example, tons of clinker produced, is a central activity input used to calculate the total use of process heating and cooling. As there is no single database that provides such figures for all European countries, various data sources were used. An overview of the main sources is provided in Table 11 including an estimate of the data completeness and quality. Table 11: Overview of sources used for production data for all countries and major processes Sub-sector / process Data source Completeness/quality of data Iron and steel World Steel Association Very complete Cement Cembureau, Odyssee Cement very complete, but clinker less robust Glass Glassglobal Complete, but calculated based on capacity and utilisation by country Pulp and paper German Pulp and Paper Asso- ciation (VDP), FAO Stat Paper very complete, pulp products less complete Aluminium and copper US Geological survey Complete for primary and secondary aluminium, less so for further treat- ment Chemicals: Ammonia UNFCCC Complete, but some uncertainty Chemicals: Ethylene UNFCCC Complete, but some uncertainty Chemicals: Oxygen Eurostat Complete, but some uncertainty and data for some small countries miss- ing Chemicals: Methanol UNFCCC Many gaps Chemicals: Polyethyl- ene UN Commodity Production Database Some uncertainty Food, drink and to- bacco Mainly UN Commodity Pro- duction Database, UN Data, German brewery association Several gaps Different by-products at different purities are obtained, including argon, neon and he- lium. Different demands for argon indicate changes in SEC but information on shares of argon and oxygen at member state level are not easily obtained. Oxygen and nitro- gen are gases that are also used in industries such as steel or glass production. In Europe the production of oxygen decreased by 23% from 2008 to 2012 i.e. from 42 to 32 million tons. Production in France, Germany and Italy has particularly fallen (EUROSTAT, PRODCOM, UN Database).
- 48. Work package 1: Final energy consumption for the year 2012 37 Specific energy fuel/electricity consumption by process was collected from litera- ture sources for each of the processes. As for the energy-intensive processes relatively similar technologies are used across countries, only a little variation is expected in international comparison. This justifies the simplification of using similar SEC values for all countries under consideration (data uncertainty is in most cases higher than the expected differences across countries). The SEC used is provided in Table 12. Table 12: SEC and share of fuels/electricity used for heating/cooling by process. Subsector Process Specific energy consumption [GJ/t] Share for heating (1=100%) Share for cooling (1=100%) Fuels Electric- ity Fuels Electric- ity Fuels Electricity Iron and steel Sinter 2.2 0.1 1.00 - - - Blast furnace 11.6 0.6 1.00 - - - Electric arc furnace 1.0 2.3 1.00 0.95 - - Rolled steel 2.4 0.6 1.00 0.10 - - Coke oven 3.2 0.1 1.00 - - - Smelting re- duction 15.0 0.4 1.00 - - - Direct reduc- tion 15.0 0.4 1.00 - - - Non- ferrous metals Aluminum, primary 5.2 53.6 1.00 0.05 - - Aluminum, secondary 9.0 1.7 1.00 0.30 - - Aluminum extruding 4.2 4.8 1.00 0.30 - - Aluminum foundries 7.2 5.6 1.00 0.30 - - Aluminium rolling 3.3 2.2 1.00 0.30 - - Copper, pri- mary 8.0 2.8 1.00 0.20 - - Copper, sec- ondary 4.0 2.3 1.00 0.10 - - Copper fur- ther treat- ment 2.0 3.8 1.00 0.15 - - Zinc, primary 1.0 15.9 1.00 0.01 - - Zinc, secon- dary 1.0 0.6 1.00 0.01 - - Pulp and Paper
- 49. Work package 1: Final energy consumption for the year 2012 38 paper 5.5 1.9 1.00 0.01 - 0.01 Chemical pulp 12.7 2.3 1.00 0.01 - - Mechanical pulp (2.0) 7.9 1.00 0.01 - - Recovered fibers 0.5 0.9 1.00 0.01 - - Glass Container glass 5.8 1.4 1.00 0.04 - 0.06 Flat glass 10.9 3.3 1.00 - - 0.06 Fiber glass 4.9 1.8 1.00 0.20 - 0.06 Other glass 11.5 5.1 1.00 0.17 - 0.06 Ceramics Houseware, sanitary ware 24.2 4.8 1.00 0.01 - 0.06 Technical, other ceram- ics 12.1 3.2 1.00 0.01 - 0.06 Tiles, plates, refractories 5.5 0.9 1.00 0.01 - 0.06 Cement Clinker Calci- nation-Dry 3.5 0.1 1.00 - - - Clinker Calci- nation- Semidry 4.0 0.2 1.00 - - - Clinker Calci- nation-Wet 5.5 0.2 1.00 - - - Preparation of limestone - 0.1 1.00 - - - Gypsum 1.0 0.2 1.00 - - - Cement grind- ing - 0.2 1.00 - - - Lime milling - 0.2 1.00 - - - Bricks 1.4 0.2 1.00 - - - Lime burning 3.7 0.1 1.00 - - - Chemicals Adipic acid 26.9 1.4 1.00 - - 0.06 Ammonia 11.3 0.5 1.00 - - 0.06 Calcium car- bide 6.1 8.3 1.00 0.95 - 0.02 Carbon black 64.8 1.8 1.00 - - 0.06 Chlorine, dia- phragma - 10.7 1.00 - - 0.05
- 50. Work package 1: Final energy consumption for the year 2012 39 Chlorine, membrane 1.9 10.0 1.00 - - 0.05 Chlorine, mercury - 12.8 1.00 - - 0.04 Ethylene 35.9 - 1.00 - - - Methanol 15.0 0.5 1.00 - - 0.04 Nitric acid (0.1) 0.0 1.00 - - 0.01 Oxygen - 1.0 1.00 - - 0.96 Poly carbon- ate 12.9 2.7 1.00 - - 0.02 Poly ethylene 0.6 2.0 1.00 - - 0.02 Poly propyl- ene 0.8 1.1 1.00 - - 0.04 Poly sulfones 24.5 3.1 1.00 - - 0.04 Soda ash 11.3 0.3 1.00 - - - TDI 26.7 2.8 1.00 0.05 - 0.02 Titanium diox- ide 34.2 3.3 1.00 - - 0.01 Food Sugar 4.5 0.7 1.00 - - 0.42 Dairy 1.6 0.5 1.00 0.05 - 0.57 Brewing 1.0 0.4 1.00 0.05 - 0.41 Meat process- ing 2.0 1.5 1.00 0.05 - 0.61 Bread & bak- ery 2.4 1.4 1.00 0.45 - 0.44 Starch 3.1 1.4 1.00 0.10 - 0.11 Plastics Extrusion 1.6 3.0 1.00 0.20 - 0.07 Injection moulding 3.9 7.3 1.00 0.20 - 0.03 Blow mould- ing 2.9 5.3 1.00 0.20 - 0.04 Source: Fraunhofer ISI: FORECAST-Industry model The share of heating/cooling in the specific energy consumption (SEC) for each process is not expected to vary between countries because the technical process de- sign is similar and the technologies used are traded internationally. The assumptions are shown in Table 12 together with the SEC. Note that the “share”-column indicates the proportion of the energy carrier group (fuel and electricity) that is used to supply heat/ cooling. For instance 100% of fuel and 45% of electricity used in the process
- 51. Work package 1: Final energy consumption for the year 2012 40 “bread & bakery” supply heat. The share for each temperature level in the SEC is also expected to remain con- stant across countries. An overview of the assumptions is provided in Table 13. For most countries, the bottom-up data in Table 12 and Table 13 explains more than 80% of total process heating and cooling demand. Table 13: Temperature level of H/C demand as share of total H/C demand by process. Subsector Process Cooling [1=100%] Heating [1=100%] <- 30°C -30- 0°C 0- 15°C <100°C 100- 200°C 200- 500°C >500° C Iron and steel Sinter - - - 0.00 - 0.20 0.80 Blast furnace - - - 0.01 0.01 0.01 0.97 Electric arc furnace - - - 0.01 0.00 0.00 0.99 Rolled steel - - - 0.00 - - 1.00 Coke oven - - - 0.00 - - 1.00 Smelting reduction - - - 0.00 - - 1.00 Direct reduction - - - 0.00 - 0.20 0.80 Non-ferrous metals Aluminum, pri- mary - - - 0.00 - - 1.00 Aluminum, secon- dary - - - 0.28 - 0.30 0.42 Aluminum extrud- ing - - - 0.00 - 1.00 - Aluminum foun- dries - - - 0.00 - - 1.00 Aluminium rolling - - - 0.00 - 1.00 - Copper, primary - - - 0.00 - - 1.00 Copper, secondary - - - 0.00 - - 1.00 Copper further treatment - - - 0.00 - 1.00 - Zinc, primary - - - 0.00 - - 1.00 Zinc, secondary - - - 0.00 - 1.00 - Pulp and paper Paper - - 1.00 0.05 0.88 0.05 0.02 Chemical pulp - - - 0.00 1.00 - -
- 52. Work package 1: Final energy consumption for the year 2012 41 Subsector Process Cooling [1=100%] Heating [1=100%] Mechanical pulp - - - 1.00 - - - Recovered fibers - - - 0.00 1.00 - - Glass Container glass - - 1.00 0.02 0.19 0.19 0.60 Flat glass - - 1.00 0.02 0.21 0.43 0.34 Fiber glass - - 1.00 0.02 0.19 0.19 0.60 Other glass - - 1.00 0.02 0.22 0.22 0.54 Ceramics Houseware, sani- tary ware - - 1.00 0.30 - - 0.70 Technical, other ceramics - - 1.00 0.30 0.15 0.15 0.40 Tiles, plates, re- fractories - - 1.00 0.07 0.11 0.07 0.75 Cement Clinker Calcina- tion-Dry - - - 0.00 - 0.10 0.90 Clinker Calcina- tion-Semidry - - - 0.00 - 0.10 0.90 Clinker Calcina- tion-Wet - - - 0.00 - 0.10 0.90 Preperation of limestone - - - 1.00 - - - Gypsum - - - 0.00 0.50 0.30 0.20 Cement grinding - - - 1.00 - - - Lime milling - - - 1.00 - - - Bricks - - - 0.20 - - 0.80 Lime burning - - - 0.00 - - 1.00 Chemicals Adipic acid 0.20 0.30 0.50 0.00 0.50 0.25 0.25 Ammonia 0.20 0.30 0.50 0.00 - - 1.00 Calcium carbide 0.20 0.30 0.50 0.00 - - 1.00 Carbon black 0.20 0.30 0.50 0.00 - - 1.00 Chlorine, dia- phragma 0.20 0.40 0.40 - - - - Chlorine, mem- brane 0.20 0.40 0.40 0.00 1.00 - - Chlorine, mercury
- 53. Work package 1: Final energy consumption for the year 2012 42 Subsector Process Cooling [1=100%] Heating [1=100%] 0.20 0.40 0.40 0.00 - - 1.00 Ethylene 0.15 0.50 0.35 0.00 - - 1.00 Methanol - 0.40 0.60 0.00 - - 1.00 Nitric acid 0.20 0.30 0.50 - - - - Oxygen 0.80 0.10 0.10 - - - - Poly carbonate - 0.40 0.60 0.00 1.00 - - Poly ethylene - 0.40 0.60 0.00 1.00 - - Poly propylene 0.05 0.40 0.55 0.00 1.00 - - Poly sulfones - 0.40 0.60 0.00 1.00 - - Soda ash 0.05 0.45 0.50 0.30 0.40 - 0.30 TDI - 0.30 0.70 0.00 1.00 - - Titanium dioxide - 0.40 0.60 0.00 0.30 0.23 0.47 Food Sugar - 0.20 0.80 0.10 0.60 - 0.30 Dairy - 0.30 0.70 0.90 0.10 - - Brewing - 0.35 0.65 0.55 0.45 - - Meat processing - 0.30 0.70 0.40 0.60 - - Bread & bakery - 0.10 0.90 0.20 0.33 0.47 - Starch - 0.20 0.80 1.00 - - - Plastics Extrusion - - 1.00 0.20 0.50 0.30 - Injection moulding - - 1.00 0.20 0.50 0.30 - Blow moulding - - 1.00 0.20 0.50 0.30 - Source: Fraunhofer ISI: FORECAST-Industry model A major challenge of the approach is that for most countries there is no data on the total floor area in industrial buildings. We calculate the total floor area by country and sub-sector based on employment statistics from Eurostat and typical values for the specific floor area in m² per employee. Employment statistics distinguish between blue and white collar workers so based on this information we can allocate the building floor area to either production buildings or office buildings. These two types of build- ings have fundamentally different needs in terms of space heating and cooling.
- 54. Work package 1: Final energy consumption for the year 2012 43 The resulting assumptions on the total floor area by country and by building type are provided in Table 14. For the model calculations, the floor area is further split by indi- vidual sub-sector. It is principally a Eurostat publication (Eurostat 2007) available, which provides de- tailed data on energy demand in space heating by energy carrier for the industrial sec- tor. However, a closer look at this data raises doubts about data quality. For example several countries have the same energy carrier shares (e.g. Spain, Greece, Italy, Por- tugal and France), and the shares for individual energy carriers for other countries are implausible (e.g. in the Czech Republic all solid fuels are used for space heating). Fur- thermore, the data is published in 2006 and probably provides information for 2004. Information about the quality of the data or its method of derivation is not provided by Eurostat (2007). Given these doubts over quality, we are not using this table for a detailed break-down of individual energy carriers. However, since we lack better data, we use the total proportion of space heating in final energy demand as provided by Eurostat, but allocate it to individual energy carriers based on model calculations. For countries where more precise values are available from national end-use energy bal- ances, we use the country specific data rather than that of Eurostat (e.g. Austria, Germany, Switzerland and the United Kingdom). The SEC for cooling and ventilation, and the share of the floor area cooled and venti- lated, is aligned with the Tertiary-sector assumptions for public offices. Other more specific data sources are not available for industry. Only two countries provide infor- mation on space cooling and ventilation for industry: Germany and Switzerland. Ger- many reports about 5 TWh for space cooling in 2012 in industry. We estimate that this value is an overestimation, as it is based on the assumption that 33% of floor area is ventilated and/or cooled. For Switzerland 0.3 TWh are reported. Also here, our estima- tion is lower. All figures in Table 14 are assumptions. There is hardly any statistical information available for buildings in the industrial sector. Accordingly, due to substantial uncer- tainty in these assumptions, the results have to be interpreted with caution. However, at the moment, these are the best figures available.
- 55. Work package 1: Final energy consumption for the year 2012 44 Table 14: Assumptions of floor area in industrial buildings, SEC and share floor area cooled and ventilated by country. Country Floor area [Million m²] 1 SECelectricity cooling and ventilation [kWh/m²] Share floor area cooled and venti- lated SEC heat- ing [kWh/m²]production office Austria 41 25 21 8% 218 Belgium 33 23 11 9% 214 Bulgaria 14 9 29 13% 208 Croatia 7 4 29 6% 168 Cyprus 0 0 55 23% 188 Czech Republic 37 21 20 12% 231 Denmark 7 5 6 8% 240 Estonia 2 1 29 5% 282 Finland 67 39 5 18% 175 France 107 73 32 14% 201 Germany 178 107 18 8% 225 Greece 21 14 43 23% 115 Hungary 11 7 23 9% 217 Iceland² 13 11 5 15% 52 Ireland 10 7 6 11% 210 Italy 154 90 62 16% 161 Latvia 3 2 23 5% 248 Lithuania 4 3 23 5% 251 Luxembourg 3 2 23 18% 132 Malta 0 0 42 13% 149 Netherlands 48 33 9 9% 204 Norway 9 6 5 15% 221 Poland 20 13 23 5% 256 Portugal 28 17 43 14% 141 Romania 32 20 10 13% 228 Slovakia² 55 30 16 15% 89 Slovenia 4 3 26 13% 198 Spain 110 73 74 18% 152 Sweden 21 12 5 16% 206 Switzerland 8 5 20 9% 143 United Kingdom 114 73 10 11% 230 1 We assume that the entire floor area is heated, while only a proportion of it is cooled and ventilated Source: own calculation Matching bottom-up and final demand The temperature shares used to allocate the “gap” between bottom-up calculation and energy balances to temperature levels is shown in Table 15. The shares are applied by first calculating the remaining energy demand after subtracting the bottom-up estima- tion from statistical energy demand for each sub-sector and energy carrier. For all
- 56. Work package 1: Final energy consumption for the year 2012 45 countries the same shares are taken, which clearly is a strong simplification, but not better data is available. Note, however, that the major share of process heat demand (for most countries > 80%) is calculated based on the bottom-up assumptions speci- fied per process in Table 12 and Table 13. Table 15: Temperature shares by sub-sector for gap calculations. Sub-sector <100°C <200°C <500°C >500°C Chemical industry 5% 15% 5% 75% Engineering and other metal 36% 48% 16% 0% Food, drink and tobacco 65% 23% 8% 5% Iron and steel 1% 3% 1% 95% Non-ferrous metals 13% 24% 8% 55% Non-metallic mineral products 9% 16% 5% 69% Other non-classified 8% 69% 23% 0% Paper and printing 8% 66% 22% 4% Source: own calculation Process cooling The area of process cooling in the industrial and tertiary sectors of the European Union comprises cooling applications for industrial purposes (see Figure 13 below). These in- clude cooling of processes in the chemical industry, the production of plastics, the pro- duction of food and its handling and other industrial processes. Further applications include cooling for meat production, bakeries or hotels, server cooling and supermar- ket cooling. There is a strong interaction of the cool supply (food industry) in which the cool supply chain is used along production, storage, transport, trade until reaching final consumers. The useful cooling energy is determined with the help of Coefficient of Performance (COP) and seasonal energy efficiency ratio (SEER) factors but contains a lot of uncertainty due to the real operating conditions of the cooling units.
- 57. Work package 1: Final energy consumption for the year 2012 46 Figure 13: Different process cooling applications across industry and tertiary sectors Source: IREES 2014 Agriculture Foodstuffs,Drinksand Tobacco ForestryShipSlaughterhouseRefrigeratedWarehousesBakerBakerSupermarketRestaurantScatingRing StockfarmingTrainFactoryShipsContainerButcherButcherDepartmentStoreHotelBobRun PoultryTruckIceProductsRefrigeratedShipsPastryCookPastryCookHypermarktFactoryCanteen… EggsAirplaneFrozenFoodIceBoxes…FloristBeverageStoreFastfoodSwimmingPools CornContainerConvenienceFoods……… WineIceProductionIceCreamRestaurants Fruit,VegetablesBreweryHotels DairyFarmingFactoryCanteen MeatMarketMineralWaterFish-Car BakeryProductsIceProduction SeetChemistry SeedlingPetrochemistrySpecialSector Pharmacy ToolDesignCryogenicEngineeringLaboratory PlasticCryogenicMedicineWindTunnels AutomotiveCryobiologyTestRooms CementProductionTechnicalGas Electronics DryIceProduction GasLiquefaction TradeTrade Trade,ServiceProvider "Leisure",Trade, Industry Industry Supermarket Production,Storage, Transport,SaleTransportProductionStorage Production, StorageStorage,SaleStorage,SaleProduction,StorageMiscellaneous
- 58. Work package 1: Final energy consumption for the year 2012 47 To illustrate the complexity of the data collection for each process, the example of process cooling demand for oxygen production is briefly discussed below. There is a high diversity of cooling processes in the different branches of industry and the tertiary sector. For example, in the chemical industry, the case of air fractioning for the production of different gases, including oxygen, is rather energy intensive at low temperature. In this case the main driver for cooling demand is the production of oxygen at member state level (see Table 16). Table 16: Annual production of Oxygen by country for 2008 and 2012 [t/a] Country 2008 2012 Austria 1,201 1,177 Belgium 3,706 2,815 Cyprus Czech Republic 1,201 1,768 Denmark Estonia 14 8 Finland 1,583 1,330 France 5,004 500 Germany 10,303 8,689 Greece 133 106 Hungary 194 215 Ireland Italy 8,549 5,737 Latvia Lithuania 3 2 Luxembourg Malta Netherlands 4,026 4,026 Poland 2,498 2,379 Portugal 99 170 Slovakia 836 791 Slovenia Spain 1,696 2,008 Sweden United Kingdom Romania 771 596 Bulgaria 532 500 Norway 44 53 Switzerland Croatia 112 33 Iceland 1,201 1,177 Source: PRODCOM, UNProduction Statistics, EUROSTAT, Chemical Associations figures The specific energy intensity for process cooling for this particular process has been