
Recomendados
Más contenido relacionado
La actualidad más candente
La actualidad más candente (20)
Similar a Complexity Metrics Impacting Maintenance & Reliability
Similar a Complexity Metrics Impacting Maintenance & Reliability (20)
Más de LeClubQualiteLogicielle
Más de LeClubQualiteLogicielle (20)
Último
Último (20)
Complexity Metrics Impacting Maintenance & Reliability
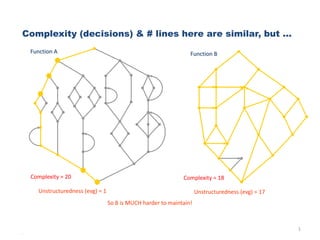
- 1. 1 Function A Complexity = 20 5.17s Unstructuredness (evg) = 1 Function B Complexity = 18 Unstructuredness (evg) = 17 So B is MUCH harder to maintain! Complexity (decisions) & # lines here are similar, but ...
- 2. 2 For these two modules, which is more likely to have Reliability problem? This is Cyclomatic Complexity, as an indicator of Reliability.
- 3. Pareto Analysis • At least 80% of run time in less than 20% of code ---- what code? • At least 80% of errors in less than 20% of code – what code? • The team will spend 80% of it’s time on less than 20% of code ---- what code? • Before hand with model, after with profiling
- 4. Quality of maintenance • Programmer productivity varies by 10X • Maintenance productivity/risk varies by 100X • The damage a poor programmer can do is only incremental • The damage a poor maintainer can do is catastrophic • How to grow and reward good ‘maintainers’? • Everyone wants to write new code, not find and reuse what’s there
- 5. 5 • Cyclomatic Complexity & Reliability Risk – 1 – 10 Simple procedure, little risk – 11- 20 More Complex, moderate risk – 21 – 50 Complex , high risk – >50 Untestable, VERY HIGH RISK • Cyclomatic Complexity & Bad Fix Probability – 1 – 10 5% – 20 –30 20% – > 50 40% – Approaching 100 60% • Essential Complexity (Unstructuredness) & Maintainability (future Reliability) Risk – 1 – 4 Structured, little risk – > 4 Unstructured, High Risk Complexity Metrics Impacting Maintenance
- 6. 6 •v(g) ev(g) iv(g) gdv(g) summary •10 1 1 1 small well structured •45 1 1 1 local data switch? •45 1 1 45 global data switch? •45 1 45 1 execution switch? •34 19 28 12 complex & unstructured Module Metrics - A Suggested Static Usage • Outlier Focus - identify most complex modules (# decisions, unstructuredness, etc.), i.e., the outliers, & focus more effort (time, experience of developer, refactoring) on them because they represent the greatest reliability risk Code Attributes by Complexity Complexity Metrics Impacting Reliability - Module
- 7. Visualizing Complex Code •Simple Code: Easy to understand, maintain, change restructure, or test •Complex code: Error prone and hard to understand, maintain, change, restructure, or test
- 8. Project Measurement Size, v increasing Unstructure
- 12. • Structure CAN be expressed in Understandable terms At Module (Unit) Level Flowgraphs w/ code Detailed metrics analysis Overlay of static and test coverage info. At Component/Design Level Structure & class charts, w/ interactions Metrics analysis of interactions Overlay of static & test coverage info. At Organization/Enterprise Level Multi-level groupings of metrics on structure (size, complexity, maintainability, etc.) Structural Code Analysis - Visualization And Metrics
- 13. 13 Component/Application - Functional Structure Chart - provides visualization of component design, with module calls and superimposed metrics coloring - is valuable for comprehension RED GREEN YELLOW GREENGREEN Potentially unmaintainable code Potentially unreliable code Small, well- structured code Library module (Always green) Development Supported By McCabe IQ V. McCabe IQ - Applying Tools for Improving Reliability
- 14. 14 Coloring Based on Path Coverage - can be based on any metric
- 15. 15 V. McCabe IQ - Applying Tools for Improving Reliability
- 16. Slicing technology • Run the transactions you want, the tool highlights executed statements and paths. • Data slicing, specified data complexity • Transaction ‘signatures’
- 17. Codebreaker • Two related problems – Finding reusable code – Finding redundant code
- 18. Some flaws are deeply hidden within the complexity Understand the Control Flow of Code
- 19. Branching out of a loop Branching in to a loop Branching into a decision Branching out of a decision Unstructured Logic
- 20. Global Data Flowgraph and Metrics
- 21. Specified Data Metric and Flowgraph
- 22. Visualizing Complex Code • Simple Code: Easy to understand, maintain, change restructure, or test • Complex code: Error prone and hard to understand, maintain, change, restructure, or test