Más contenido relacionado Similar a Sample SD Budget Summary 2015 (20) 1. Sample School District
2016‐17 General Fund Summary
1/19/2016, 2:34 PM
Major Function Major Object
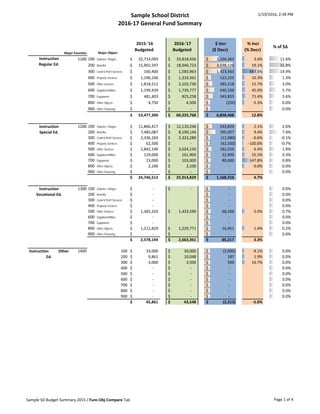
1100 100 - Salaries / Wages 32,714,093$ 33,818,456$ 1,104,363$ 3.4% 11.6%
200 - Benefits 15,902,597$ 18,940,723$ 3,038,126$ 19.1% 31.9%
300 - Contr'd Prof'l Services 160,400$ 1,583,963$ 1,423,563$ 887.5% 14.9%
400 - Property Services 1,196,106$ 1,319,361$ 123,255$ 10.3% 1.3%
500 - Other Services 1,818,512$ 2,103,730$ 285,218$ 15.7% 3.0%
600 - Supplies/Utilities 1,199,439$ 1,739,777$ 540,338$ 45.0% 5.7%
700 - Equipment 481,403$ 825,258$ 343,855$ 71.4% 3.6%
800 - Other Objects 4,750$ 4,500$ (250)$ ‐5.3% 0.0%
900 - Other Financing ‐$ ‐$ ‐$ #DIV/0! 0.0%
53,477,300$ 60,335,768$ 6,858,468$ 12.8%
1200 100 - Salaries / Wages 11,866,417$ 12,110,246$ 243,829$ 2.1% 2.6%
200 - Benefits 7,485,087$ 8,190,144$ 705,057$ 9.4% 7.4%
300 - Contr'd Prof'l Services 2,336,269$ 2,323,289$ (12,980)$ ‐0.6% ‐0.1%
400 - Property Services 62,500$ ‐$ (62,500)$ ‐100.0% ‐0.7%
500 - Other Services 2,842,140$ 3,024,150$ 182,010$ 6.4% 1.9%
600 - Supplies/Utilities 129,000$ 161,900$ 32,900$ 25.5% 0.3%
700 - Equipment 23,000$ 103,000$ 80,000$ 347.8% 0.8%
800 - Other Objects 2,100$ 2,100$ ‐$ 0.0% 0.0%
900 - Other Financing ‐$ ‐$ ‐$ #DIV/0! 0.0%
24,746,513$ 25,914,829$ 1,168,316$ 4.7%
1300 100 - Salaries / Wages ‐$ ‐$ ‐$ #DIV/0! 0.0%
200 - Benefits ‐$ ‐$ #DIV/0! 0.0%
300 - Contr'd Prof'l Services ‐$ ‐$ #DIV/0! 0.0%
400 - Property Services ‐$ ‐$ #DIV/0! 0.0%
500 - Other Services 1,365,324$ 1,433,590$ 68,266$ 5.0% 0.7%
600 - Supplies/Utilities ‐$ ‐$ #DIV/0! 0.0%
700 - Equipment ‐$ ‐$ #DIV/0! 0.0%
800 - Other Objects 1,212,820$ 1,229,771$ 16,951$ 1.4% 0.2%
900 - Other Financing ‐$ ‐$ ‐$ #DIV/0! 0.0%
2,578,144$ 2,663,361$ 85,217$ 3.3%
1400 100 33,000$ 30,000$ (3,000)$ ‐9.1% 0.0%
200 9,861$ 10,048$ 187$ 1.9% 0.0%
300 3,000$ 3,500$ 500$ 16.7% 0.0%
400 ‐$ ‐$ ‐$ #DIV/0! 0.0%
500 ‐$ ‐$ ‐$ #DIV/0! 0.0%
600 ‐$ ‐$ ‐$ #DIV/0! 0.0%
700 ‐$ ‐$ ‐$ #DIV/0! 0.0%
800 ‐$ ‐$ ‐$ #DIV/0! 0.0%
900 ‐$ ‐$ ‐$ #DIV/0! 0.0%
45,861$ 43,548$ (2,313)$ ‐5.0%
Instruction
Vocational Ed.
Instruction Other
Ed.
Instruction
Special Ed.
% of $∆
2015‐'16
Budgeted
2016‐'17
Budgeted
$ Incr
($ Decr)
% Incr
(% Decr)
Instruction
Regular Ed.
Sample SD Budget Summary 2015 / Func‐Obj Compare Tab Page 1 of 4
2. Sample School District
2016‐17 General Fund Summary
1/19/2016, 2:34 PM
Major Function Major Object
% of $∆
2015‐'16
Budgeted
2016‐'17
Budgeted
$ Incr
($ Decr)
% Incr
(% Decr)
2100 100 - Salaries / Wages 2,817,983$ 2,857,553$ 39,570$ 1.4% 0.4%
200 - Benefits 1,498,586$ 1,691,527$ 192,941$ 12.9% 2.0%
300 - Contr'd Prof'l Services 217,504$ 152,500$ (65,004)$ ‐29.9% ‐0.7%
400 - Property Services ‐$ ‐$ ‐$ #DIV/0! 0.0%
500 - Other Services 6,475$ 6,375$ (100)$ ‐1.5% 0.0%
600 - Supplies/Utilities 195,002$ 161,437$ (33,565)$ ‐17.2% ‐0.4%
700 - Equipment ‐$ ‐$ ‐$ #DIV/0! 0.0%
800 - Other Objects 42,550$ 42,550$ ‐$ 0.0% 0.0%
900 - Other Financing ‐$ ‐$ ‐$ #DIV/0! 0.0%
4,778,100$ 4,911,942$ 133,842$ 2.8%
2200 100 - Salaries / Wages 2,038,975$ 1,968,603$ (70,372)$ ‐3.5% ‐0.7%
200 - Benefits 1,249,369$ 1,198,335$ (51,034)$ ‐4.1% ‐0.5%
300 - Contr'd Prof'l Services 15,000$ 134,860$ 119,860$ 799.1% 1.3%
400 - Property Services 21,089$ 21,339$ 250$ 1.2% 0.0%
500 - Other Services 7,920$ 8,220$ 300$ 3.8% 0.0%
600 - Supplies/Utilities 268,395$ 314,348$ 45,953$ 17.1% 0.5%
700 - Equipment 1,082$ 1,082$ ‐$ 0.0% 0.0%
800 - Other Objects 10,050$ 10,050$ ‐$ 0.0% 0.0%
900 - Other Financing ‐$ ‐$ ‐$ #DIV/0! 0.0%
3,611,880$ 3,656,837$ 44,957$ 1.2%
2300 100 - Salaries / Wages 3,855,588$ 4,034,494$ 178,906$ 4.6% 1.9%
200 - Benefits 2,009,971$ 2,240,736$ 230,765$ 11.5% 2.4%
300 - Contr'd Prof'l Services 499,187$ 652,487$ 153,300$ 30.7% 1.6%
400 - Property Services 400$ 400$ ‐$ 0.0% 0.0%
500 - Other Services 198,048$ 189,376$ (8,672)$ ‐4.4% ‐0.1%
600 - Supplies/Utilities 36,885$ 38,035$ 1,150$ 3.1% 0.0%
700 - Equipment ‐$ ‐$ ‐$ #DIV/0! 0.0%
800 - Other Objects 52,853$ 46,900$ (5,953)$ ‐11.3% ‐0.1%
900 - Other Financing ‐$ ‐$ ‐$ #DIV/0! 0.0%
6,652,932$ 7,202,428$ 549,496$ 8.3%
2400 100 - Salaries / Wages 802,953$ 761,848$ (41,105)$ ‐5.1% ‐0.4%
200 - Benefits 473,849$ 527,318$ 53,469$ 11.3% 0.6%
300 - Contr'd Prof'l Services 691,190$ 711,190$ 20,000$ 2.9% 0.2%
400 - Property Services 200$ 200$ ‐$ 0.0% 0.0%
500 - Other Services ‐$ ‐$ ‐$ #DIV/0! 0.0%
600 - Supplies/Utilities 21,360$ 17,410$ (3,950)$ ‐18.5% 0.0%
700 - Equipment ‐$ ‐$ ‐$ #DIV/0! 0.0%
800 - Other Objects ‐$ ‐$ ‐$ #DIV/0! 0.0%
900 - Other Financing ‐$ ‐$ ‐$ #DIV/0! 0.0%
1,989,552$ 2,017,966$ 28,414$ 1.4%
Supervision of Pupil
Personnel
Library & Computer‐
Assistive Instruction
Administrative &
Secretarial Services
Pupil Health Services
Sample SD Budget Summary 2015 / Func‐Obj Compare Tab Page 2 of 4
3. Sample School District
2016‐17 General Fund Summary
1/19/2016, 2:34 PM
Major Function Major Object
% of $∆
2015‐'16
Budgeted
2016‐'17
Budgeted
$ Incr
($ Decr)
% Incr
(% Decr)
2500 100 - Salaries / Wages 555,091$ 567,066$ 11,975$ 2.2% 0.1%
200 - Benefits 321,333$ 355,116$ 33,783$ 10.5% 0.4%
300 - Contr'd Prof'l Services 6,000$ 7,000$ 1,000$ 16.7% 0.0%
400 - Property Services 9,500$ 4,500$ (5,000)$ ‐52.6% ‐0.1%
500 - Other Services 36,200$ 22,500$ (13,700)$ ‐37.8% ‐0.1%
600 - Supplies/Utilities 2,635$ 3,600$ 965$ 36.6% 0.0%
700 - Equipment 1,500$ ‐$ (1,500)$ ‐100.0% 0.0%
800 - Other Objects 1,000$ 1,000$ ‐$ 0.0% 0.0%
900 - Other Financing ‐$ ‐$ ‐$ #DIV/0! 0.0%
933,259$ 960,782$ 27,523$ 2.9%
2600 100 - Salaries / Wages 3,397,546$ 3,142,656$ (254,890)$ ‐7.5% ‐2.7%
200 - Benefits 2,109,934$ 2,094,382$ (15,552)$ ‐0.7% ‐0.2%
300 - Contr'd Prof'l Services 89,200$ 89,200$ ‐$ 0.0% 0.0%
400 - Property Services 4,511,629$ 5,157,875$ 646,246$ 14.3% 6.8%
500 - Other Services 343,209$ 371,088$ 27,879$ 8.1% 0.3%
600 - Supplies/Utilities 1,286,505$ 1,286,505$ ‐$ 0.0% 0.0%
700 - Equipment 105,000$ 105,000$ ‐$ 0.0% 0.0%
800 - Other Objects 13,150$ 13,150$ ‐$ 0.0% 0.0%
900 - Other Financing ‐$ ‐$ ‐$ #DIV/0! 0.0%
11,856,173$ 12,259,856$ 403,683$ 3.4%
2700 100 - Salaries / Wages 95,871$ 98,034$ 2,163$ 2.3% 0.0%
200 - Benefits 71,323$ 76,594$ 5,271$ 7.4% 0.1%
300 - Contr'd Prof'l Services 5,000$ 5,000$ ‐$ 0.0% 0.0%
400 - Property Services 5,000$ 5,000$ ‐$ 0.0% 0.0%
500 - Other Services 7,200,467$ 7,451,825$ 251,358$ 3.5% 2.6%
600 - Supplies/Utilities 565$ 565$ ‐$ 0.0% 0.0%
700 - Equipment ‐$ ‐$ ‐$ #DIV/0! 0.0%
800 - Other Objects 250$ 250$ ‐$ 0.0% 0.0%
900 - Other Financing ‐$ ‐$ ‐$ #DIV/0! 0.0%
7,378,476$ 7,637,268$ 258,792$ 3.5%
2800 100 - Salaries / Wages 1,071,697$ 1,106,263$ 34,566$ 3.2% 0.4%
200 - Benefits 680,130$ 730,208$ 50,078$ 7.4% 0.5%
300 - Contr'd Prof'l Services 118,296$ 125,511$ 7,215$ 6.1% 0.1%
400 - Property Services 68,368$ 89,328$ 20,960$ 30.7% 0.2%
500 - Other Services 174,816$ 182,255$ 7,439$ 4.3% 0.1%
600 - Supplies/Utilities 337,210$ 363,423$ 26,213$ 7.8% 0.3%
700 - Equipment ‐$ ‐$ ‐$ #DIV/0! 0.0%
800 - Other Objects 1,760$ 1,600$ (160)$ ‐9.1% 0.0%
900 - Other Financing ‐$ ‐$ ‐$ #DIV/0! 0.0%
2,452,277$ 2,598,588$ 146,311$ 6.0%
Student
Transportation
Services
Central Support
Services
Business Services
Maintenance &
Custodial Services
Sample SD Budget Summary 2015 / Func‐Obj Compare Tab Page 3 of 4
4. Sample School District
2016‐17 General Fund Summary
1/19/2016, 2:34 PM
Major Function Major Object
% of $∆
2015‐'16
Budgeted
2016‐'17
Budgeted
$ Incr
($ Decr)
% Incr
(% Decr)
2900 100 - Salaries / Wages ‐$ ‐$ ‐$ #DIV/0! 0.0%
200 - Benefits ‐$ ‐$ ‐$ #DIV/0! 0.0%
300 - Contr'd Prof'l Services ‐$ ‐$ ‐$ #DIV/0! 0.0%
400 - Property Services ‐$ ‐$ ‐$ #DIV/0! 0.0%
500 - Other Services 111,700$ 111,700$ ‐$ 0.0% 0.0%
600 - Supplies/Utilities ‐$ ‐$ ‐$ #DIV/0! 0.0%
700 - Equipment ‐$ ‐$ ‐$ #DIV/0! 0.0%
800 - Other Objects ‐$ ‐$ ‐$ #DIV/0! 0.0%
900 - Other Financing ‐$ ‐$ ‐$ #DIV/0! 0.0%
111,700$ 111,700$ ‐$ 0.0%
3200 100 - Salaries / Wages 1,184,763$ 1,190,020$ 5,257$ 0.4% 0.1%
200 - Benefits 472,940$ 504,065$ 31,125$ 6.6% 0.3%
300 - Contr'd Prof'l Services 78,524$ 78,524$ ‐$ 0.0% 0.0%
400 - Property Services 56,410$ 69,410$ 13,000$ 23.0% 0.1%
500 - Other Services 206,897$ 199,897$ (7,000)$ ‐3.4% ‐0.1%
600 - Supplies/Utilities 63,300$ 63,300$ ‐$ 0.0% 0.0%
700 - Equipment 59,000$ 59,000$ ‐$ 0.0% 0.0%
800 - Other Objects 28,650$ 28,750$ 100$ 0.3% 0.0%
900 - Other Financing ‐$ ‐$ ‐$ #DIV/0! 0.0%
2,150,484$ 2,192,966$ 42,482$ 2.0%
3300 100 - Salaries / Wages 48,000$ 40,000$ (8,000)$ ‐16.7% ‐0.1%
200 - Benefits 14,344$ 13,396$ (948)$ ‐6.6% 0.0%
300 - Contr'd Prof'l Services ‐$ ‐$ ‐$ #DIV/0! 0.0%
400 - Property Services ‐$ ‐$ ‐$ #DIV/0! 0.0%
500 - Other Services 150$ 150$ ‐$ 0.0% 0.0%
600 - Supplies/Utilities 5,000$ 5,000$ ‐$ 0.0% 0.0%
700 - Equipment ‐$ ‐$ ‐$ #DIV/0! 0.0%
800 - Other Objects ‐$ ‐$ ‐$ #DIV/0! 0.0%
900 - Other Financing ‐$ ‐$ ‐$ #DIV/0! 0.0%
67,494$ 58,546$ (8,948)$ ‐13.3%
5100 800 - Other Objects 4,503,600$ 4,610,124$ 106,524$ 2.4% 1.1%
Financing & 5200 900 - Other Financing 9,255,000$ 9,334,953$ 79,953$ 0.9% 0.8%
13,758,600$ 13,945,077$ 186,477$ 1.4%
5900 800 - Other Objects ‐$ ‐$ ‐$ #DIV/0! 0.0%
900 - Other Financing 400,000$ ‐$ (400,000)$ ‐100.0% ‐4.2%
400,000$ ‐$ (400,000)$ ‐100.0%
Total Expenditures: 136,988,745$ 146,511,462$ 9,522,717$ 7.0%
Major Function
6000 Local Revenue 107,071,342$ 114,747,089$ 7,675,747$ 7.2%
7000 State Revenue 25,797,925$ 26,821,528$ 1,023,603$ 4.0%
8000 Federal Revenue 619,478$ 639,290$ 19,812$ 3.2%
Utilize Fund Balance 3,500,000$ 4,303,555$ 803,555$ 23.0%
Total Revenues: 136,988,745$ 146,511,462$ 9,522,717$ 7.0%
Net Surplus (Deficit) ‐$ ‐$
Community Services
Revenue
Other Support
Services
Student Activities
Debt Services
Budgetary Reserve
Sample SD Budget Summary 2015 / Func‐Obj Compare Tab Page 4 of 4