Recommended

Recommended
More Related Content
What's hot
What's hot (20)
Similar to Poster presentation - Documented Clonality Report for Regulatory Submission
Similar to Poster presentation - Documented Clonality Report for Regulatory Submission (20)
Recently uploaded
Recently uploaded (20)
Poster presentation - Documented Clonality Report for Regulatory Submission
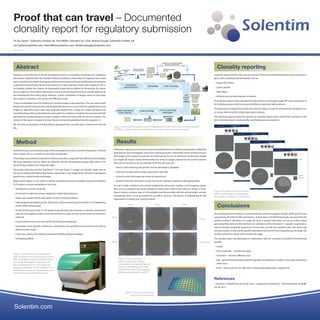
- 1. Proof that can travel – Documented clonality report for regulatory submission Dr Ian Taylor*, Solentim Limited, UK. Paul Miller, Solentim Inc, USA, Andrea Gough, Solentim Limited, UK Ian.Taylor@solentim.com, Paul.Miller@solentim.com, Andrea.Gough@solentim.com *First author Abstract Clonality is a key element of cell line development and is an important component of a regulatory submission. Indeed for BLA, the clonality of MCB is mandatory. Historically, the regulator has insisted upon2roundsofcloningfordevelopingacelllineandassuranceofmonoclonalitybasedonstatistical outgrowth measurements. Recent improvements in high resolution whole well imaging of cells in microplates, enables the creation of indisputable image-based evidence for the growth of a colony from a single cell.This evidence eliminates a round of sub-cloning and results in several weeks of cell line development time being saved. However, current compilation of images using ‘cut and paste’ into a report is laborious, error-prone and difficult to audit. A new standardized report for evidence of clonality images is described here. The user selects wells basedupongrowthcharacteristicsanddynamicallyinteractson-screenwiththeoriginaltimecourse images to determine which wells were originally seeded with a single cell. Single cell feature are annotatedalongwithanyotherfeaturesinthewell.Onceanalysisiscomplete,theuserautomatically generates the contemporaneous report in paper or electronic form with the click of a button. The content of the report is designed to meet the recommended guidelines from the regulator (1). We will show an illustrative Clonality Report generated from raw data with a commercial CHO cell line. Method Verification that a new manufacturing cell line developed to produce a protein therapeutic is derived from a single cell (i.e. is clonal) is an absolute requirement. Historically,usingstatisticalmethodsfordilutionandcolonyoutgrowthwassufficient,butnowadays the drug regulators and the clients for upstream cell line development groups alike want to see documentary evidence of a single cell origin. This poster illustrates how the Cell Metric™ CLD (see Figure 1) imager can identify single cells on the day of seeding (D0) before they divide, and provide a clear image of the cell and its subsequent growth into a colony for documentation. Below and in Figure 2 is an outline a cell line development process workflow using the Cell Metric CLD system to ensure traceability of the clone: Transfection or fusion of cell line Enrichment or selective pressure applied to isolate high producers Single cells seeded into 96 wells plates via FACS or limiting dilution Cellsimagedatseveraltimepoints:Day0,Day1(24hourslater),Day4/5andDay10-14(depending on the cell line being used) On the last time point (Day 10-14), based on growth data and sometimes crude titer assessments, wells are interrogated to select clones derived from a single cell. See results section for how this is achieved Chosen positive clones are selected for hit-picking and expansion. Subsequent clone growth (confluence), productivity and specificity are monitored and used to determine best clones Clones are scaled up for further growth/titer/stability testing and Master Cell Banking (MCB) Results Following imaging at set time points over the growth period, the software automatically collates the plate data for user interrogation. Each well containing growth is selected for review and the previous well images (at the earlier time points) are examined by the user to determine if each clone started as a single cell. Figure 3 below demonstrates the series of images captured by the system and how they can be reviewed to ensure clonality. To do this, the user will… Select a well containing cell growth; the full well image is displayed Click back through earlier images captured for that well Zoom in to the well image and review the growth loci Decide if the well is clonal/non-clonal and use the software to label the well appropriately As well as high resolution and contrast imaging the instrument employs a well mapping system that occurs simultaneously during imaging to ensure each 100% of the wells are always in focus. Figure 4 shows a contour map of a 96 well plate and demonstrates that the surface height can vary dramatically which, if not accounted for, can affect cell focus. This feature is fundamental for the requirement to qualify your cloning method. Clonality reporting Using the export function, the user can track and choose all/selected time points and annotate for a given well containing vital information such as: Single cell location Colony growth Plate debris Artifacts and any other features of interest The software exports these well-specific time points as a multi-page single PDF report (see Figure 5) for individual clones which have been identified as potential high producers. The ideal way to evaluate these wells and write the report is at the PC terminal of the Cell Metric CLD or at your desk using the remote data viewer software. The report function provides the operator an exported option that is “proof that can travel” in the form of printed reports, electronic files and Powerpoint presentations. Conclusions As providing proof of clonality is recommended by numerous guidance bodies (WHO and ICH) and requested by the FDA for IND submissions; “Submit data to the IND that provides assurance that this method resulted in derivation of a single cell clone or provide information on how you will go about generating these data and the timeframe for submission of the information”1 , typically to generate a report manually would take many hours or even days, and will vary between users. The report may not even be able to show all the specific information that the FDA have requested e.g. the single cell location within the context of the whole well image. The clonality report was developed in collaboration with our customers and delivers the following benefits Simple Fast to generate – minutes per report Consistent – between different users Safe – gives all the information that the regulator has asked for in relation to the origin and history of the clone Proof – that can be sent to CMO client, cell banking departments, regulator etc. References 1. Kennett S.“Establishing Clonal Cell Lines – a Regulatory Perspective”- FDA presentation at WCBP, Jan 30, 2014 Figure 1: Cell Metric CLD is a dedicated high-resolution bench-top imaging system with integrated, heated microplate loader, specifically developed to speed up cell line development (CLD). The unique cell imaging capabilities of the Cell Metric CLD enable fast, unequivocal identification and tracking of single-cell derived clones. The Cell MetricTM uses two different imaging modes for different time points during the workflow. On the day of seeding the “verify clonality”mode is used, which results in a higher contrast and takes approximately 4 minutes per 96 well plate (depending on plate type). For subsequent days, the“clone growth”mode is used and gives a faster speed per plate of around 3 minutes. A typical cell line development project will run over several months and generates a large amount of image data. Hence it is important to practically consider how this data will be stored and managed from an IT perspective. Each whole plate image in high resolution mode is around 150 MB. A batch of 50 microplates, each imaged at 4 time points will therefore generate around 30 GB of data. This is easily handled by the Terabyte hard drive of the Cell MetricTM computer, while it can also be stored cost effectively on an external back-up hard drive. If required, the Cell MetricTM can store the scan results directly onto a network drive, thus removing the need to copy the image data off of the Cell MetricTM PC at the end of a project. The key to this process is to generate and store an undisputed image of a single cell on the day of seeding. The Cell MetricTM is able to achieve this using bright field imaging only, with no requirements for fluorescence or other labels. There are several key aspects of the imager which make this application possible: 1. High resolution and high contrast imaging to observe a single cell (see Figures 1 and 3). 2. Accurate focussing and contrast - cells clea the media background (see Figures 1 and technology, the Cell MetricTM tracks the co the microplate to correct for any distortio that may have occurred during manu images across a well and all wells across completely in focus. 3. Even illumination right up to the edges the cells often accumulate. (Note the c Figures 1 and 3). 4. Multiple images are captured per well and together to form a single continuous, high Examples are shown of single cells imag seeding, which have subsequently divid 24 hours later for both 96 well plates a (see Figures 1 and 3). Different customer workflows will use th on the day of seeding in different ways. S track images every day after seeding for and then review the Day 1 image to esta may facilitate the earlier selection of clon Other customers may do little intervening Day 1 and say Day 14, choosing to advan to assess growth rate and amount of prote then going back and checking the Day 1 only the subset of best producers to estab Data and Discussion Figure 2: Workflow when clones are seeded by FACS or limiting dilution. Figure 3: Whole well image of a 384 well plate with inset zoom images of the cells on the edge of the well A) Day of seeding – single cell; B) After 24 hours – pair of cells. A B Cells are the typical suspension cells employed in CLD groups, such as CHO-S, or CHO DG44, which are seeded by limiting dilutions (LD) or flow cytometry (FACS) e.g. using a BD FACS Aria (Becton Dickinson), aiming for a single cell in each well of either a 96 well plate or, in some instances, 384 well plates (see Figure 2). Choice of plate is important for the best imaging results.Typically a flat-bottomed tissue culture plate or occasionally a U-bottom plate can be used. Plate quality and handling are important to minimise the contamination of plates by foreign objects and to avoid finger prints on the base of the wells. It is also useful to filter the tissue culture medium to remove particulates which could otherwise show up in the images.Wells should typically be around two-thirds full with media to avoid the meniscus at the top of the well causing shadows when imaging. After seeding, cells need to settle to the bottom of the well to be ready for imaging, as the Cell MetricTM will focus on a monolayer at the base of the well. Cells can be allowed to settle passively which takes at least 2 hours, or the plates can be centrifuged at 200 RCF for 2 to 5 minutes to encourage the cells down to the well bottom. The Cell MetricTM software organises all of the settings that are required to scan a batch of plates into a‘scan profile’. A profile can be set up in advance and reused for each plate in a batch. The scan settings include parameters to specify the microplate type being used, the focus offset to the bottom of the wells and the illumination settings for optimal image quality. For monitoring colony growth, cell detection parameters can also be adjusted. Once a scan profile is set up in the software, it can be selected from the menu, with the user pressing a single button to scan the plate. Plate identification is achieved either by reading a barcode on the plate or from being manually typed in by the user. The plate ID is used to update the history of the plate so that well growth curves and time course images for each well, from cell through to colony, can be easily generated. Images are captured on the day of seeding (Day 1) as soon as the cells have settled. This is the essential time point, which is later used to establish clonality before the cells have had a chance to divide.Itisnotimportantifcellssubsequentlymovelateronwhen plates are handled, so long as the first image shows a single cell. Images can then be captured on subsequent days to monitor the presence and rate of colony growth. Confluence data can be used to quantify colony growth and to determine which wells contain colonies whose supernatants will be assayed for protein secretion or productivity, using an ELISA assay, an HTRF assay or the ForteBio Octet (Pall Corporation). Figure 2: Overview for a typical cell line development workflow with the use of the Solentim Cell Metric CLD for verification of clonality and colony outgrowth measurements. Figure 3: Time series (Day 7, 1 and 0) of whole well images interrogated for single cell derived clones. A) Displaying the images captured for well B2. B) Displaying the images captured for well B11. Figure 5: Example of the PDF version of the Clonality Report generated by the Solentim Cell Metric CLD software. Figure 4: Focus assurance map of an entire 96 well plate. A) B2 B) B11 Clonal Non-Clonal Day 7 Day 1 Day 0 Clonality Report Batch Sample Seeding Project Page 1 of 4 Plate CHOZN plated 022315 Well F6 Image 23/02/2015 21:00 Whole Well Main Feature Single cell Other Features Debris Imagery and report obtained using Solentim Cell Metric™ Report generated 07/03/2016 12:05 1mm 500µm 50µm Well Timeline 23/02/2015 21:00 (Seed time) 24/02/2015 15:12 (Hour 19) 02/03/2015 16:41 (Day 7) 09/03/2015 15:21 (Day 14) Clonality Report Batch Sample Seeding Project Page 2 of 4 Plate CHOZN plated 022315 Well F6 Image 24/02/2015 15:12 Whole Well Main Feature Single cell (note relates to image from 23/02/2015 21:00) Other Features Debris (note relates to image from 23/02/2015 21:00) Imagery and report obtained using Solentim Cell Metric™ Report generated 07/03/2016 12:05 1mm 500µm 50µm Well Timeline 23/02/2015 21:00 (Seed time) 24/02/2015 15:12 (Hour 19) 02/03/2015 16:41 (Day 7) 09/03/2015 15:21 (Day 14) Clonality Report Batch Sample Seeding Project Page 3 of 4 Plate CHOZN plated 022315 Well F6 Image 02/03/2015 16:41 Whole Well Main Feature Single cell Other Features Debris (note relates to image from 23/02/2015 21:00) Imagery and report obtained using Solentim Cell Metric™ Report generated 07/03/2016 12:05 1mm 500µm 50µm Well Timeline 23/02/2015 21:00 (Seed time) 24/02/2015 15:12 (Hour 19) 02/03/2015 16:41 (Day 7) 09/03/2015 15:21 (Day 14) Clonality Report Batch Sample Seeding Project Page 4 of 4 Plate CHOZN plated 022315 Well F6 Image 09/03/2015 15:21 Whole Well Main Feature Single cell Other Features Debris (note relates to image from 23/02/2015 21:00) Imagery and report obtained using Solentim Cell Metric™ Report generated 07/03/2016 12:05 1mm 500µm 50µm Well Timeline 23/02/2015 21:00 (Seed time) 24/02/2015 15:12 (Hour 19) 02/03/2015 16:41 (Day 7) 09/03/2015 15:21 (Day 14)